Data can be daunting. And making it easy to understand and helpful enough to drive informed decisions can be a real challenge.
Professional-looking reports, with charts and other visual elements, allow you to measure the performance of an initiative, get buy-in from stakeholders, make important decisions, and ultimately convince people to take action.
But gathering the data you need, compiling it all, and creating a detailed, comprehensive report can take hours. This can throw your productivity out of whack by forcing you to put other important tasks on the back burner and play catch-up later.
Jotform Report Builder can save you time by using submitted information from online forms to instantly create eye-catching reports and presentations.
You can build a report that meets your needs in a matter of minutes, not hours or days.
The best part is that there’s no added cost to use Jotform Report Builder — even Jotform users with free Starter plans can use it.
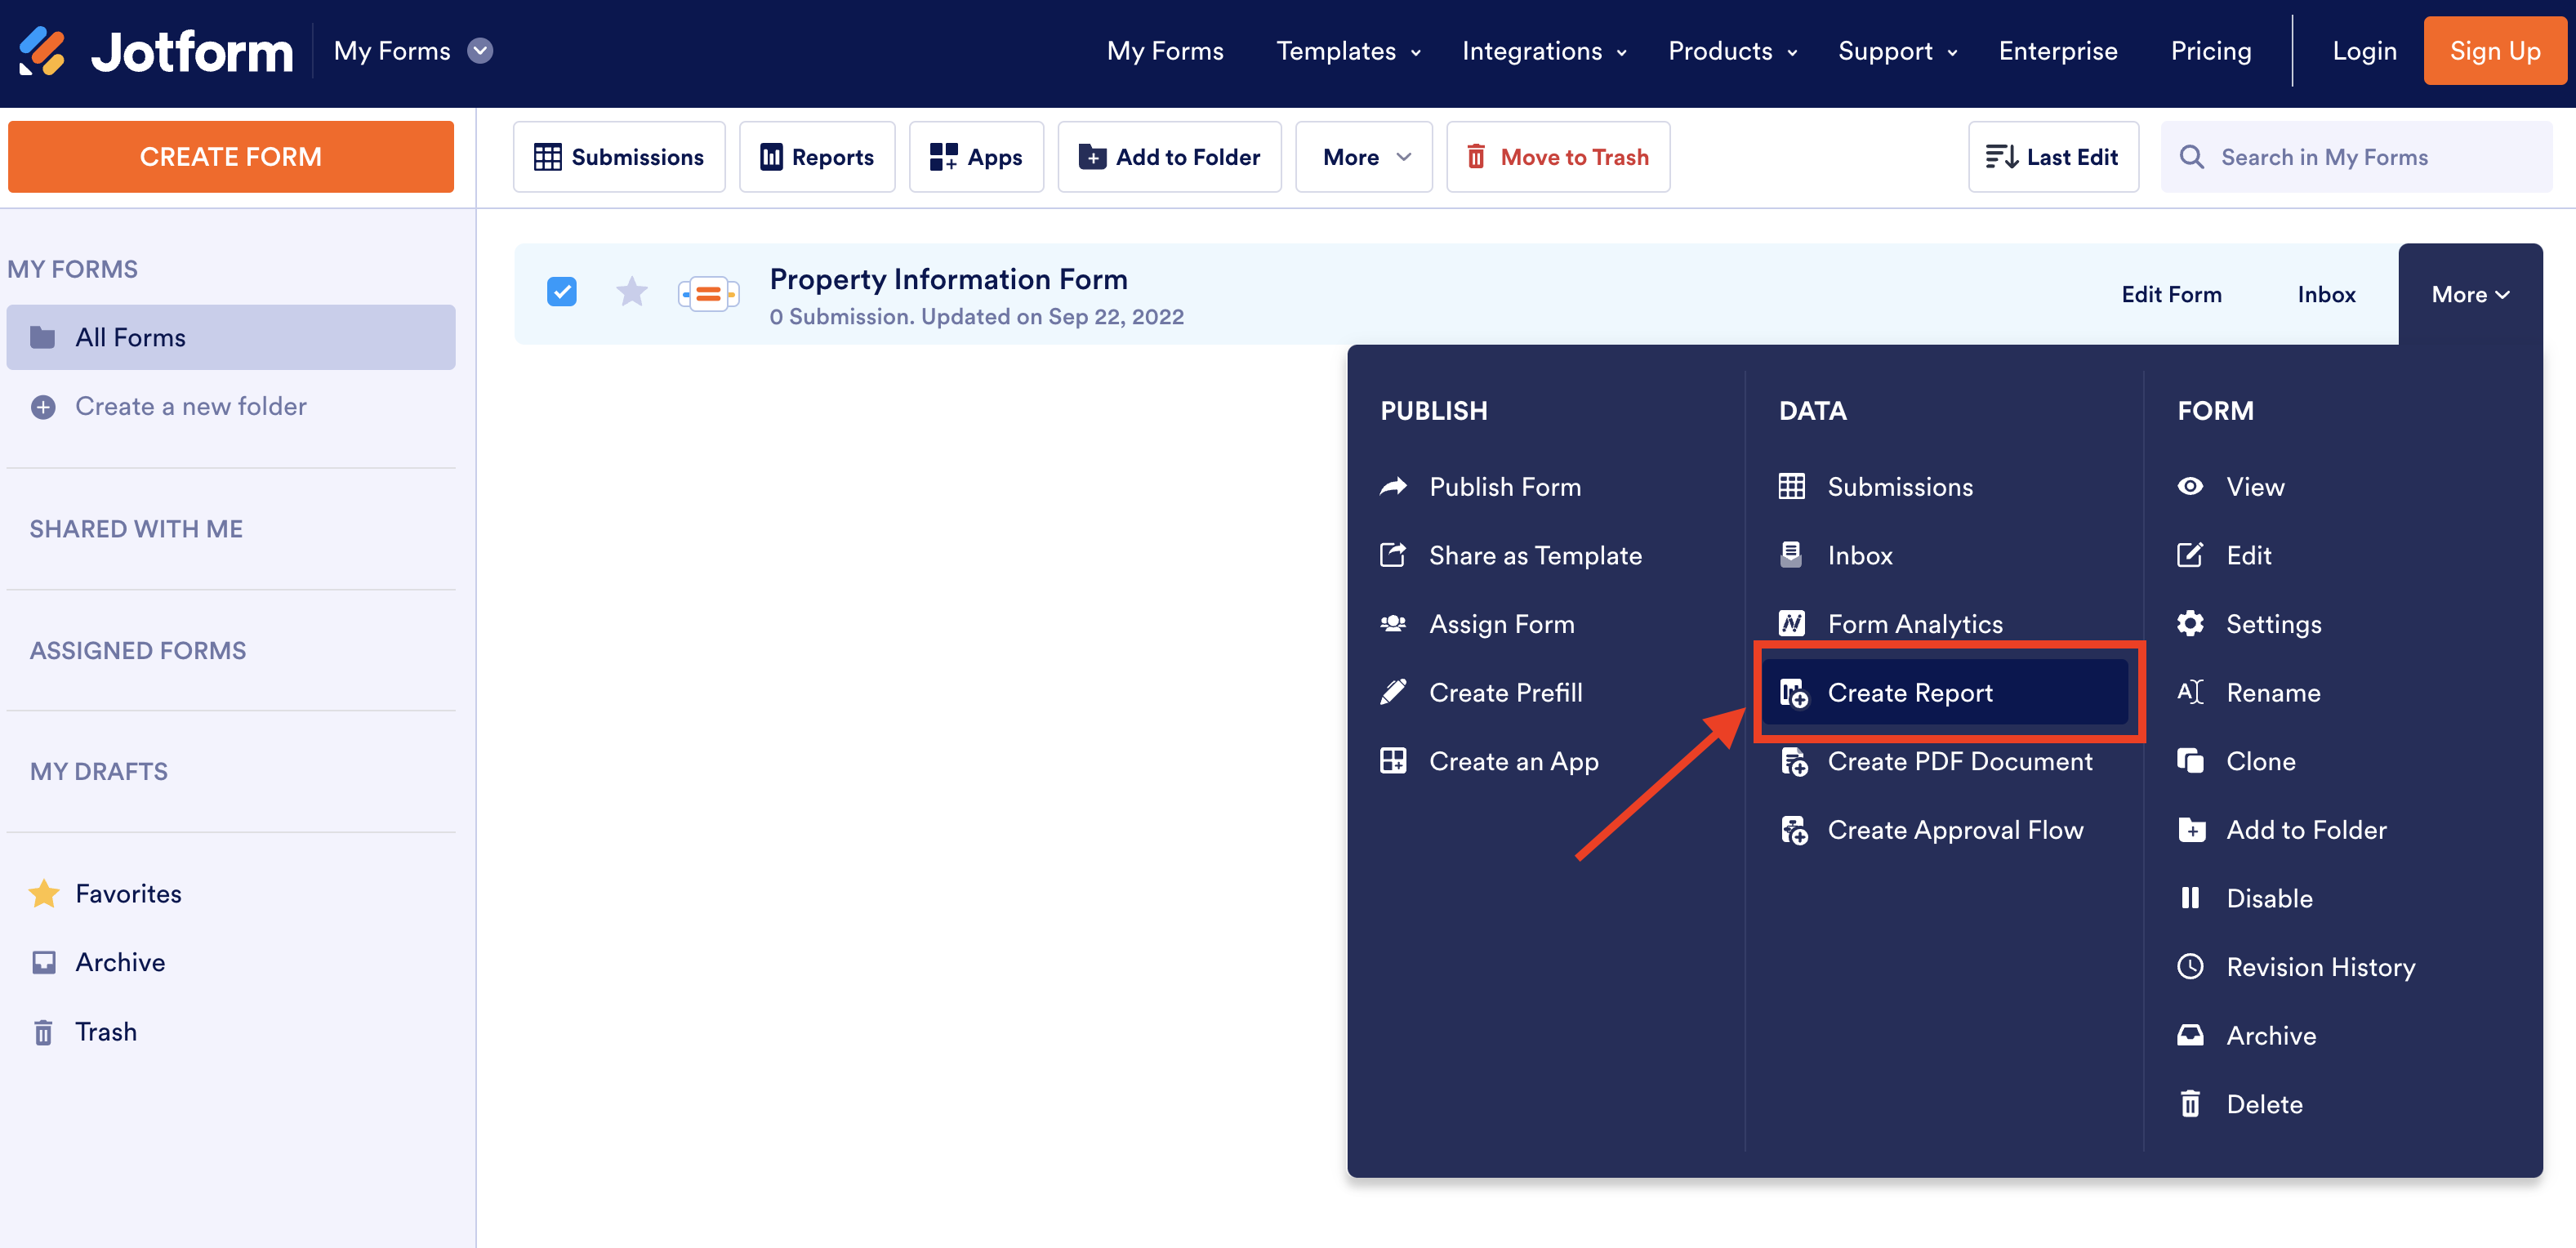
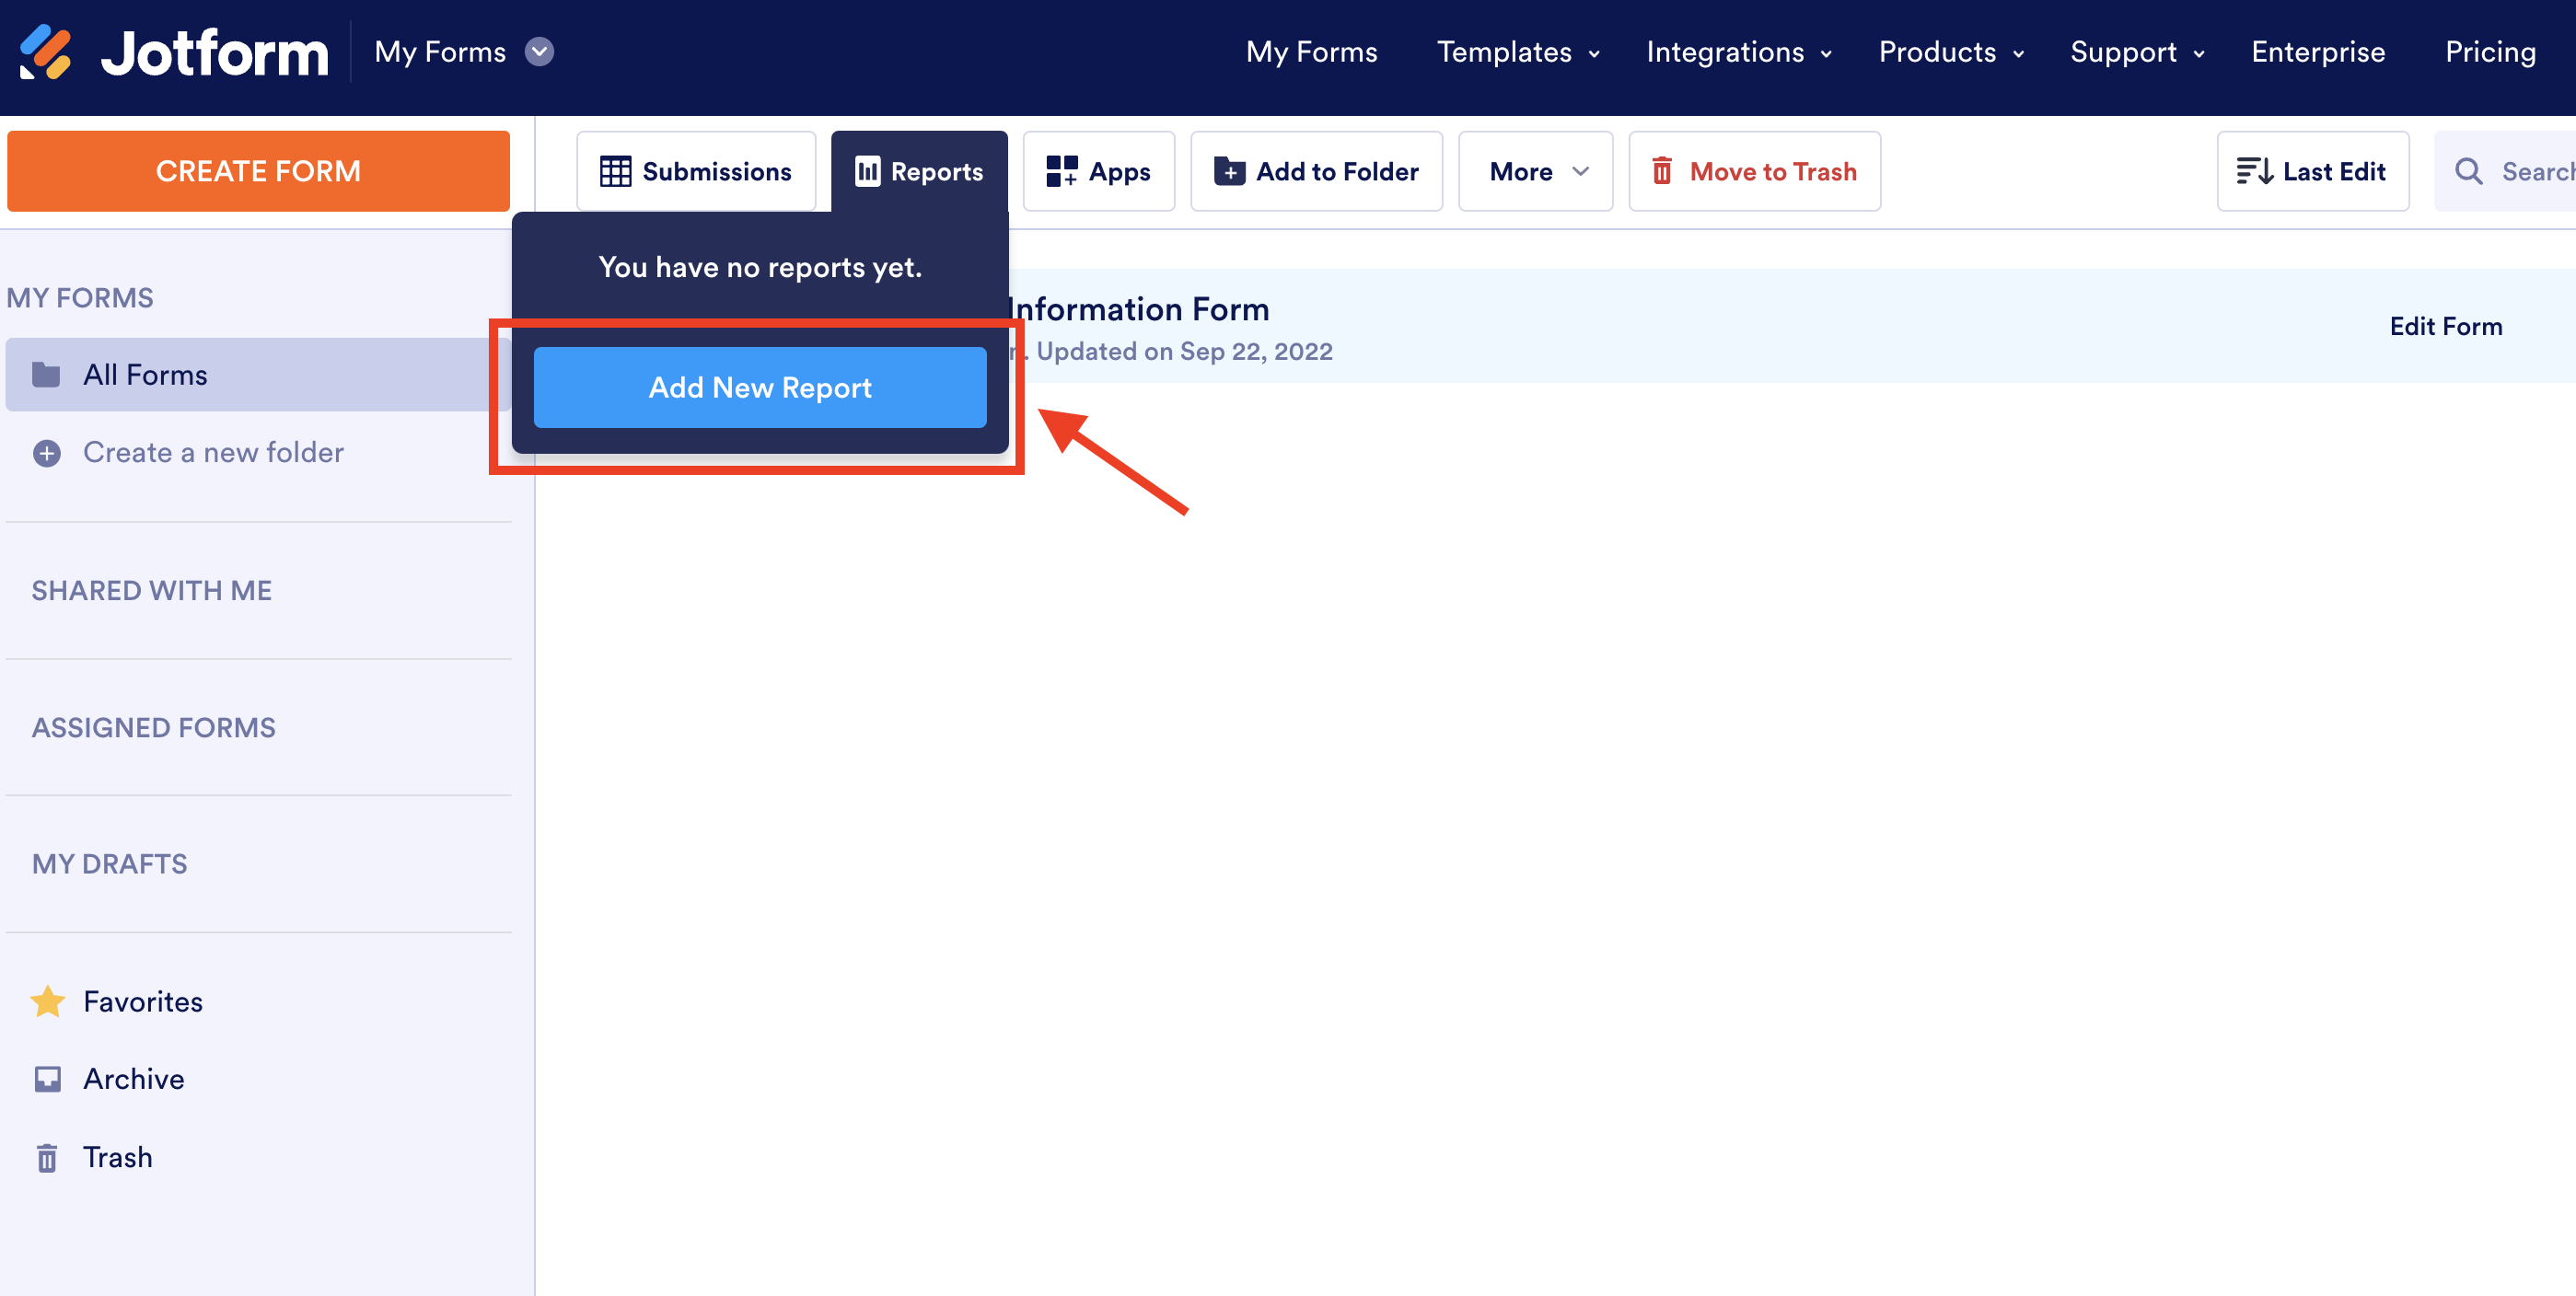
Once you log into your Jotform account, it takes less than a minute to access Jotform Report Builder from the My Forms page and generate the report you need.
If all of this rings a bell, you’re on the right track.
Regardless of whether you’re evaluating a program’s performance, distributing resources, or identifying areas for improvement, Jotform can turn submitted form data into clear, neatly organized reports that help decision-makers chart a course in the right direction.
Below we’ll highlight all of the exciting features that make it easier than ever to build, organize, customize, and share reports in no time.
Check it out…
See how the American College of Occupational and Environmental Medicine and an affordable housing developer in South Africa use Jotform to share feedback data and present results.
Jotform Report Builder — behind the scenes
Nearly a decade ago, Jotform released a data visualization tool that displayed submitted form information in graphs and charts.
Over time, however, the tool became increasingly unwieldy, outdated, and difficult to manage.
Some Jotform users found that this data reporting feature couldn’t
- Change how data was displayed in graphs or charts, such as ordering responses based on the Likert scale
- Provide more ways to share reports with specific people
- Narrow down what type of data is displayed on reports, based on specific responses to form questions
- Embed reports on websites
- Display certain data in a table-like format
- Give reports a polished, professional look
For almost a year, we spoke with Jotform users to learn more about how they collected form information, created reports, and shared their findings.
We soon discovered that businesses and organizations around the world were using reports in a number of different ways:
- A burgeoning church in North Carolina uses reports to improve its children’s ministry program and offer additional support to volunteer leaders.
- A property management and development company in South Africa that uses reports to highlight the success of their affordable housing projects.
- A professional medical society uses reports to analyze feedback from experts, glean insights, and present important findings at a medical conference.
What you see today is a culmination of their input and feedback.
Jotform is now an all-in-one solution that allows you to create online forms, collect the data you need, build captivating reports, and control how they are shared.
That means you can create a customizable survey, poll, questionnaire, feedback form, or voting form, and use the responses to instantly generate a data-driven report without relying on another software tool.
Since Jotform offers HIPAA-friendly online forms, data from coronavirus response forms or medical surveys and questionnaires can be used to generate reports that drive critical decisions, such as how to reopen businesses during the COVID-19 pandemic.
Build attractive reports without breaking a sweat
When you need to get all of your ducks in a row before a critical meeting that’s happening in a few hours, you have to be efficient.
You can’t afford to spend an hour or more creating a report that illustrates the results of a data set and explains how an overarching issue, question, or problem can be resolved.
Jotform Report Builder can help you save time by quickly turning submitted form information into thorough, compelling, and visually appealing reports that get your point across to your audience.
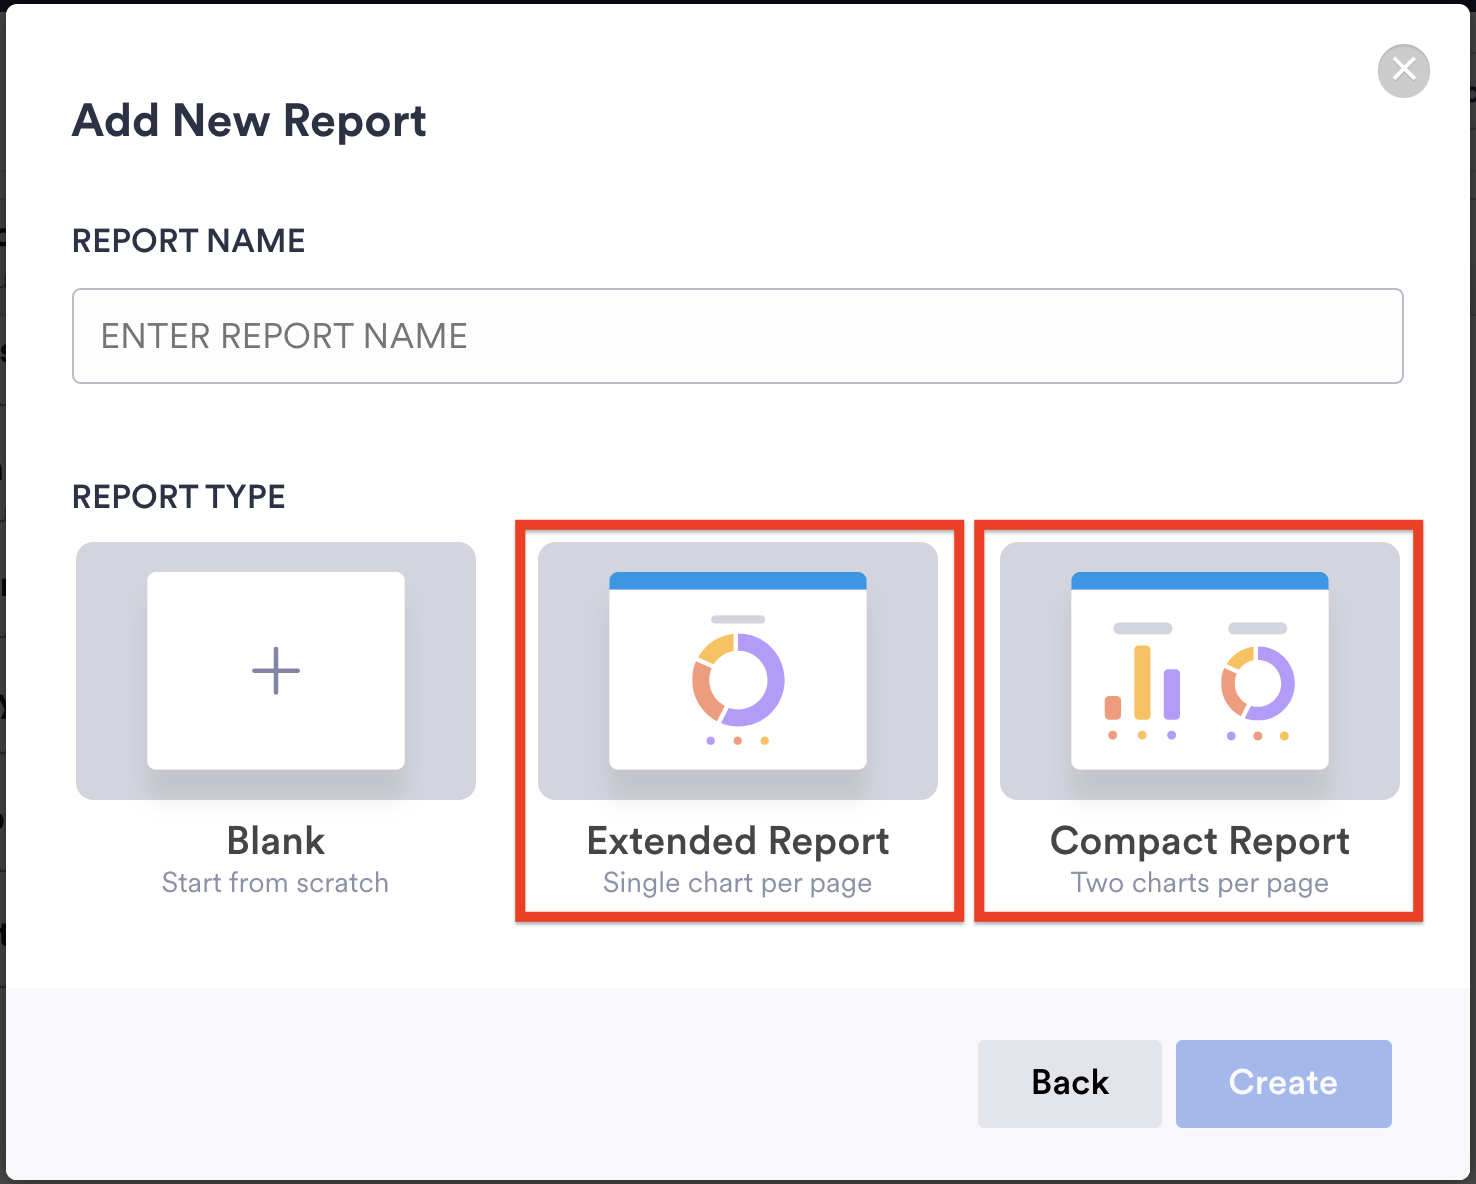
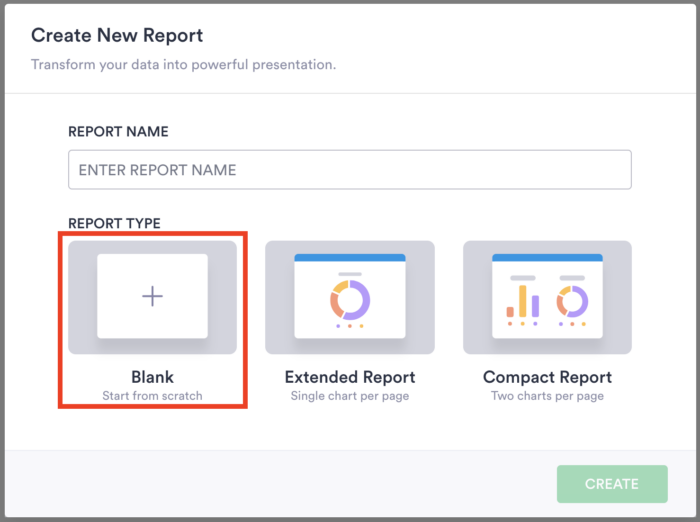
Once you decide to create a report for a specific online form in your Jotform account, simply specify whether one or two charts should be displayed on each page.
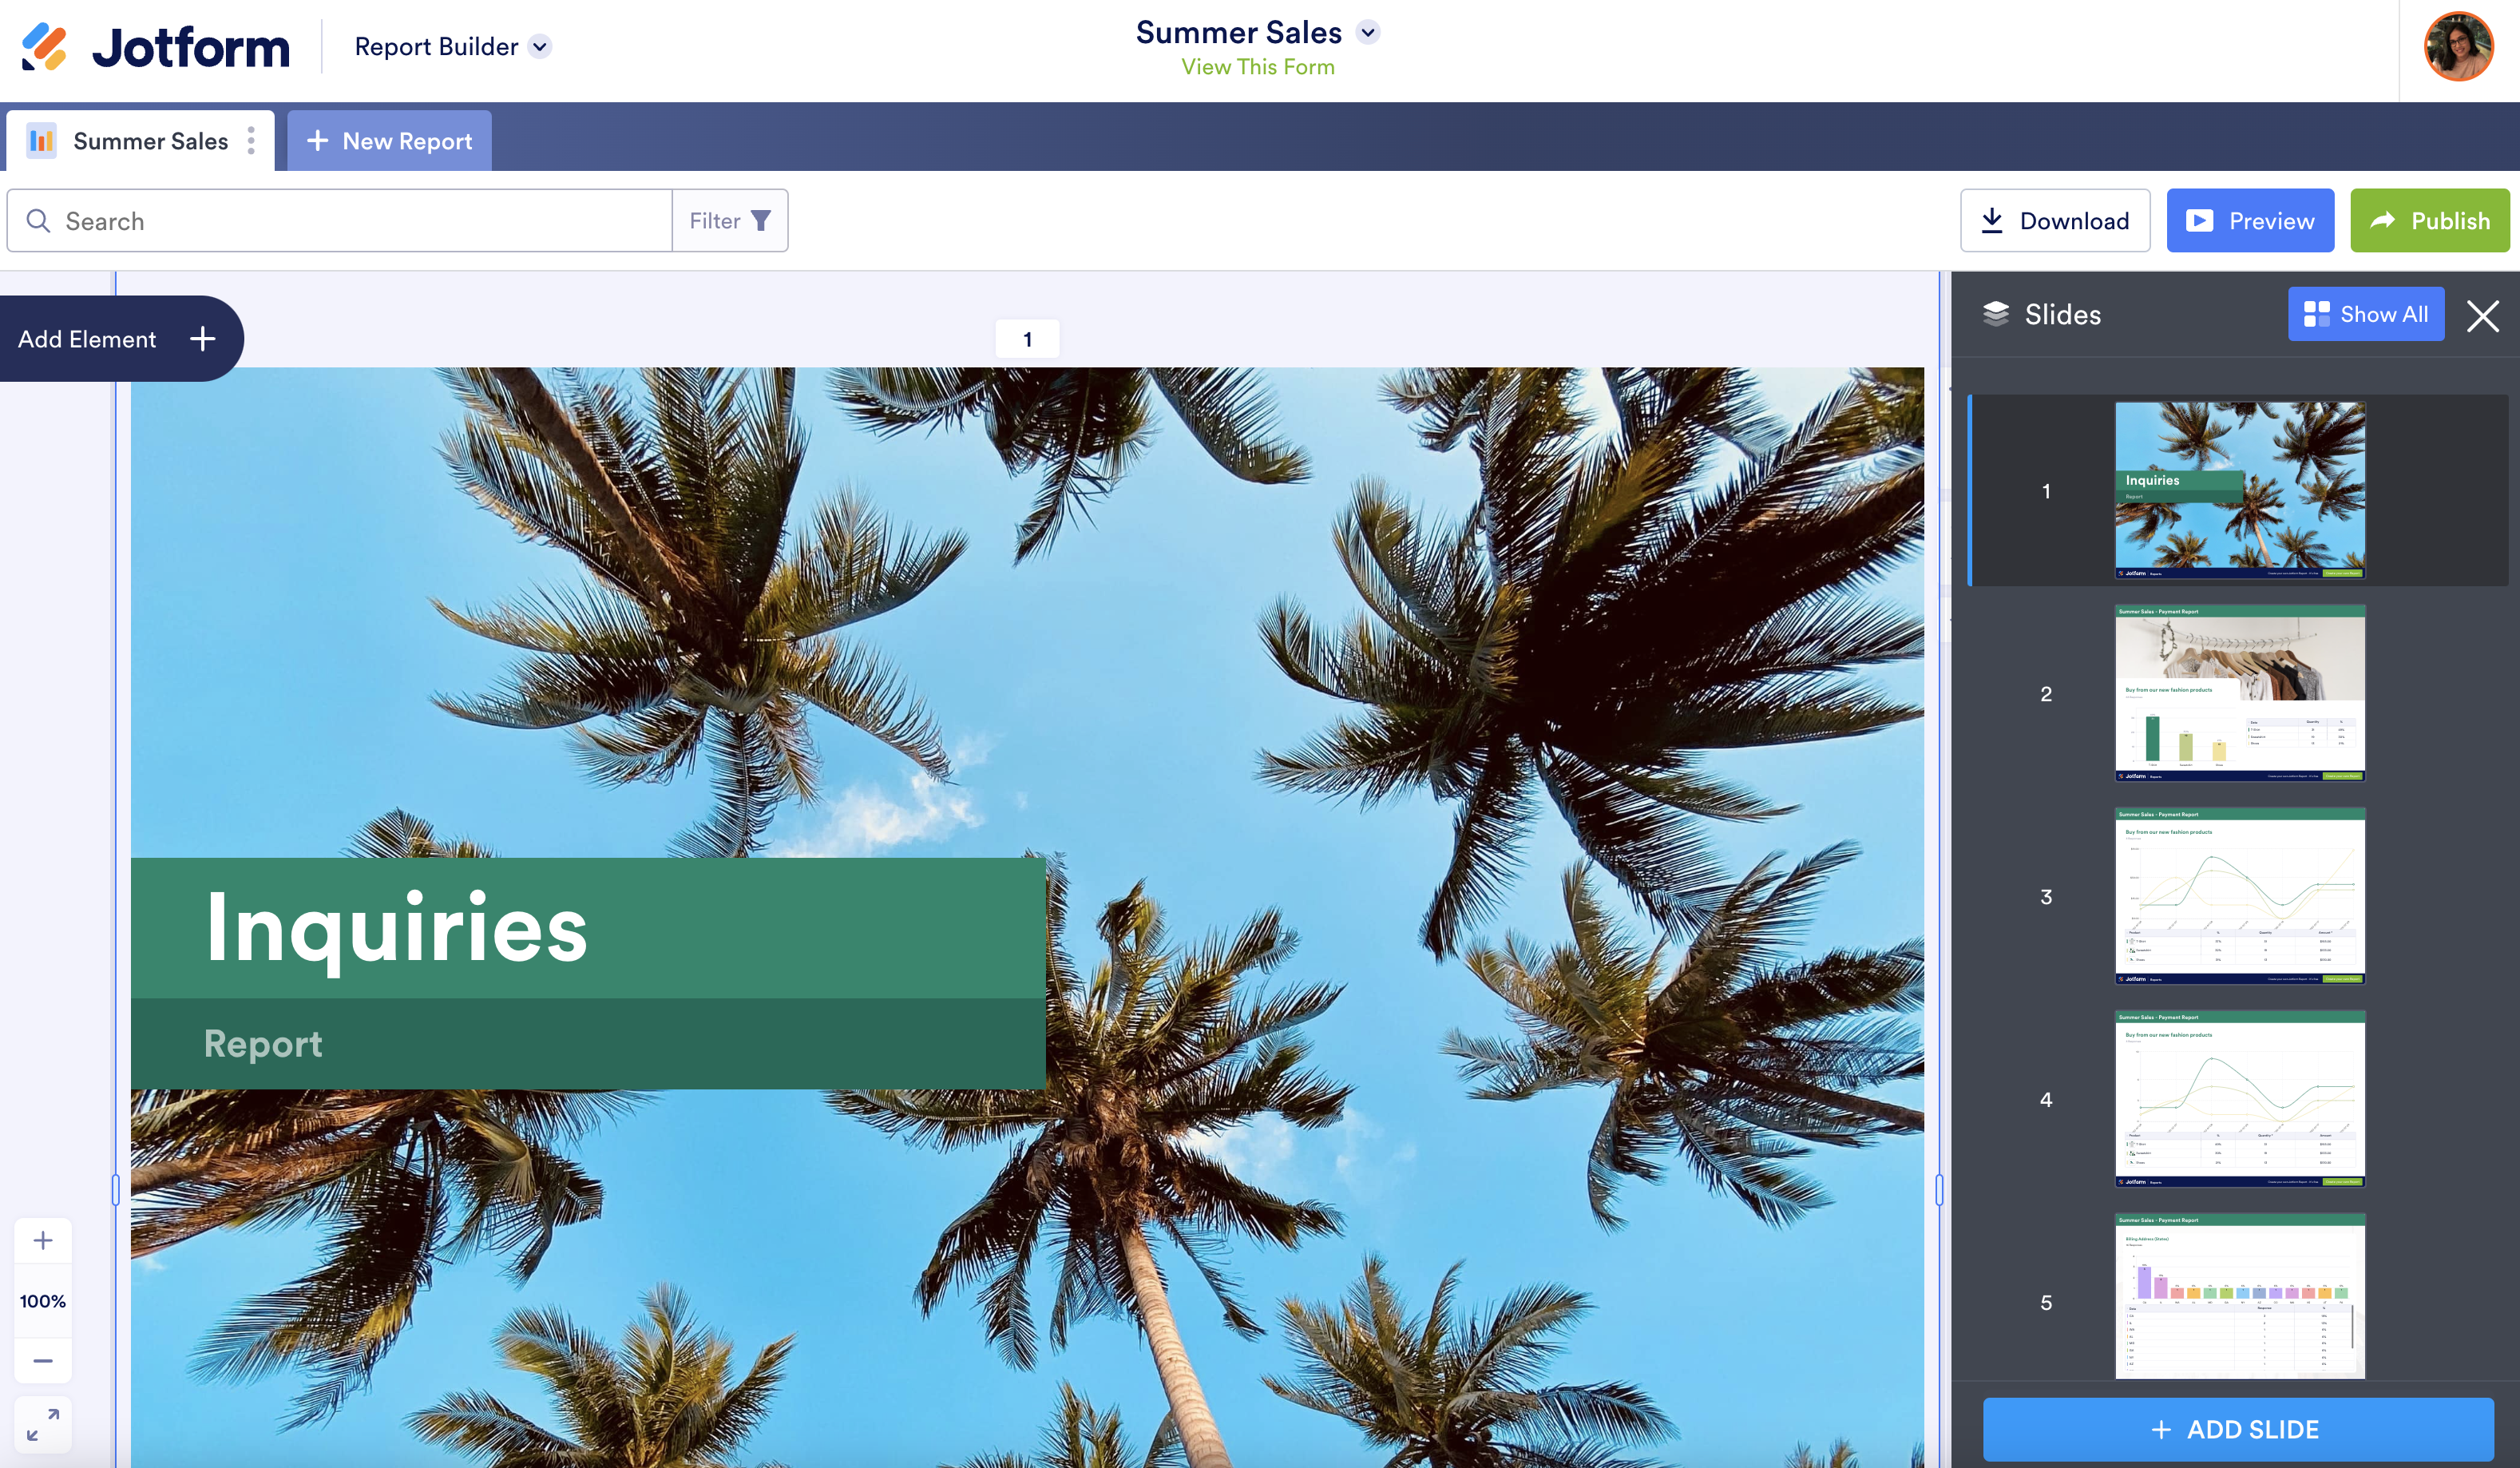
What you get is a report that can be edited within minutes to match your needs.
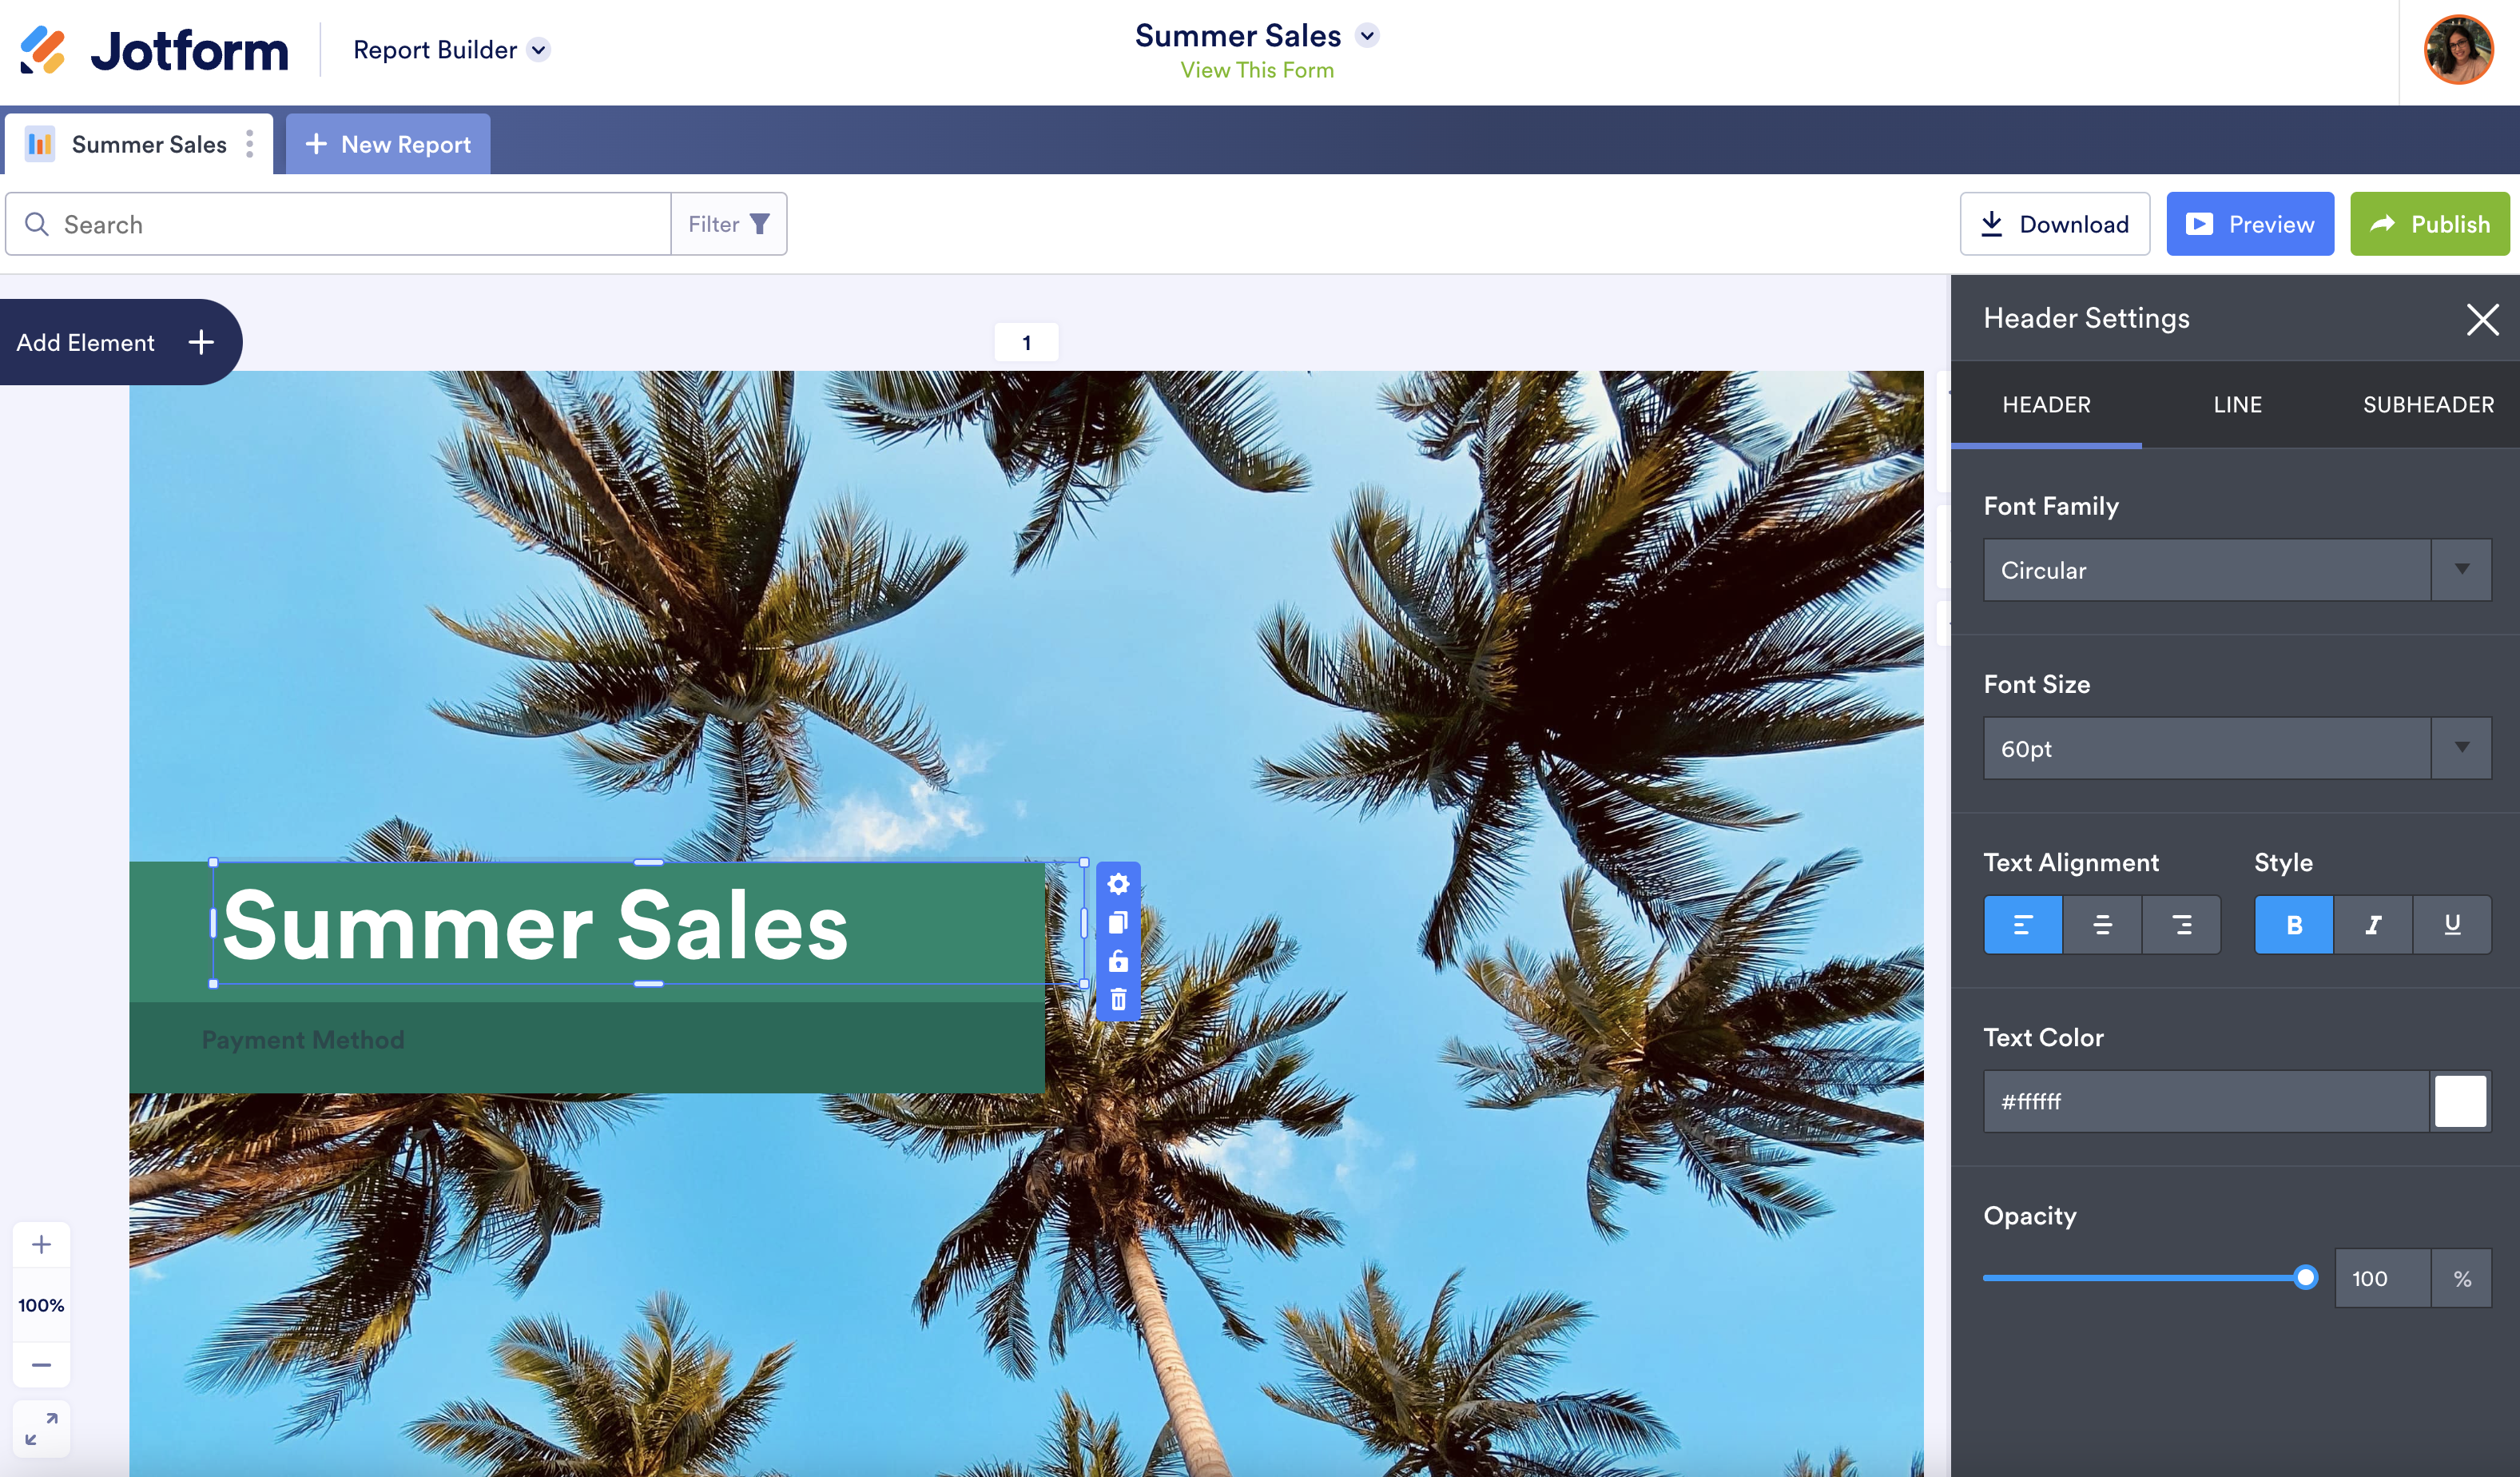
In fact, you can add new text, modify the background color, change the fonts, and add a subheader, among many other things.
Since Jotform generates reports from online forms in seconds, you can now spend more time on other tasks or send the report to colleagues and team members to review before you finalize it.
Easily customize the design and format of your report
Instantly generating professional reports from online form responses saves you time, but what if you want to create something really special?
With Jotform Report Builder, you can build a report from scratch and customize the design so that it reflects your company’s unique brand.
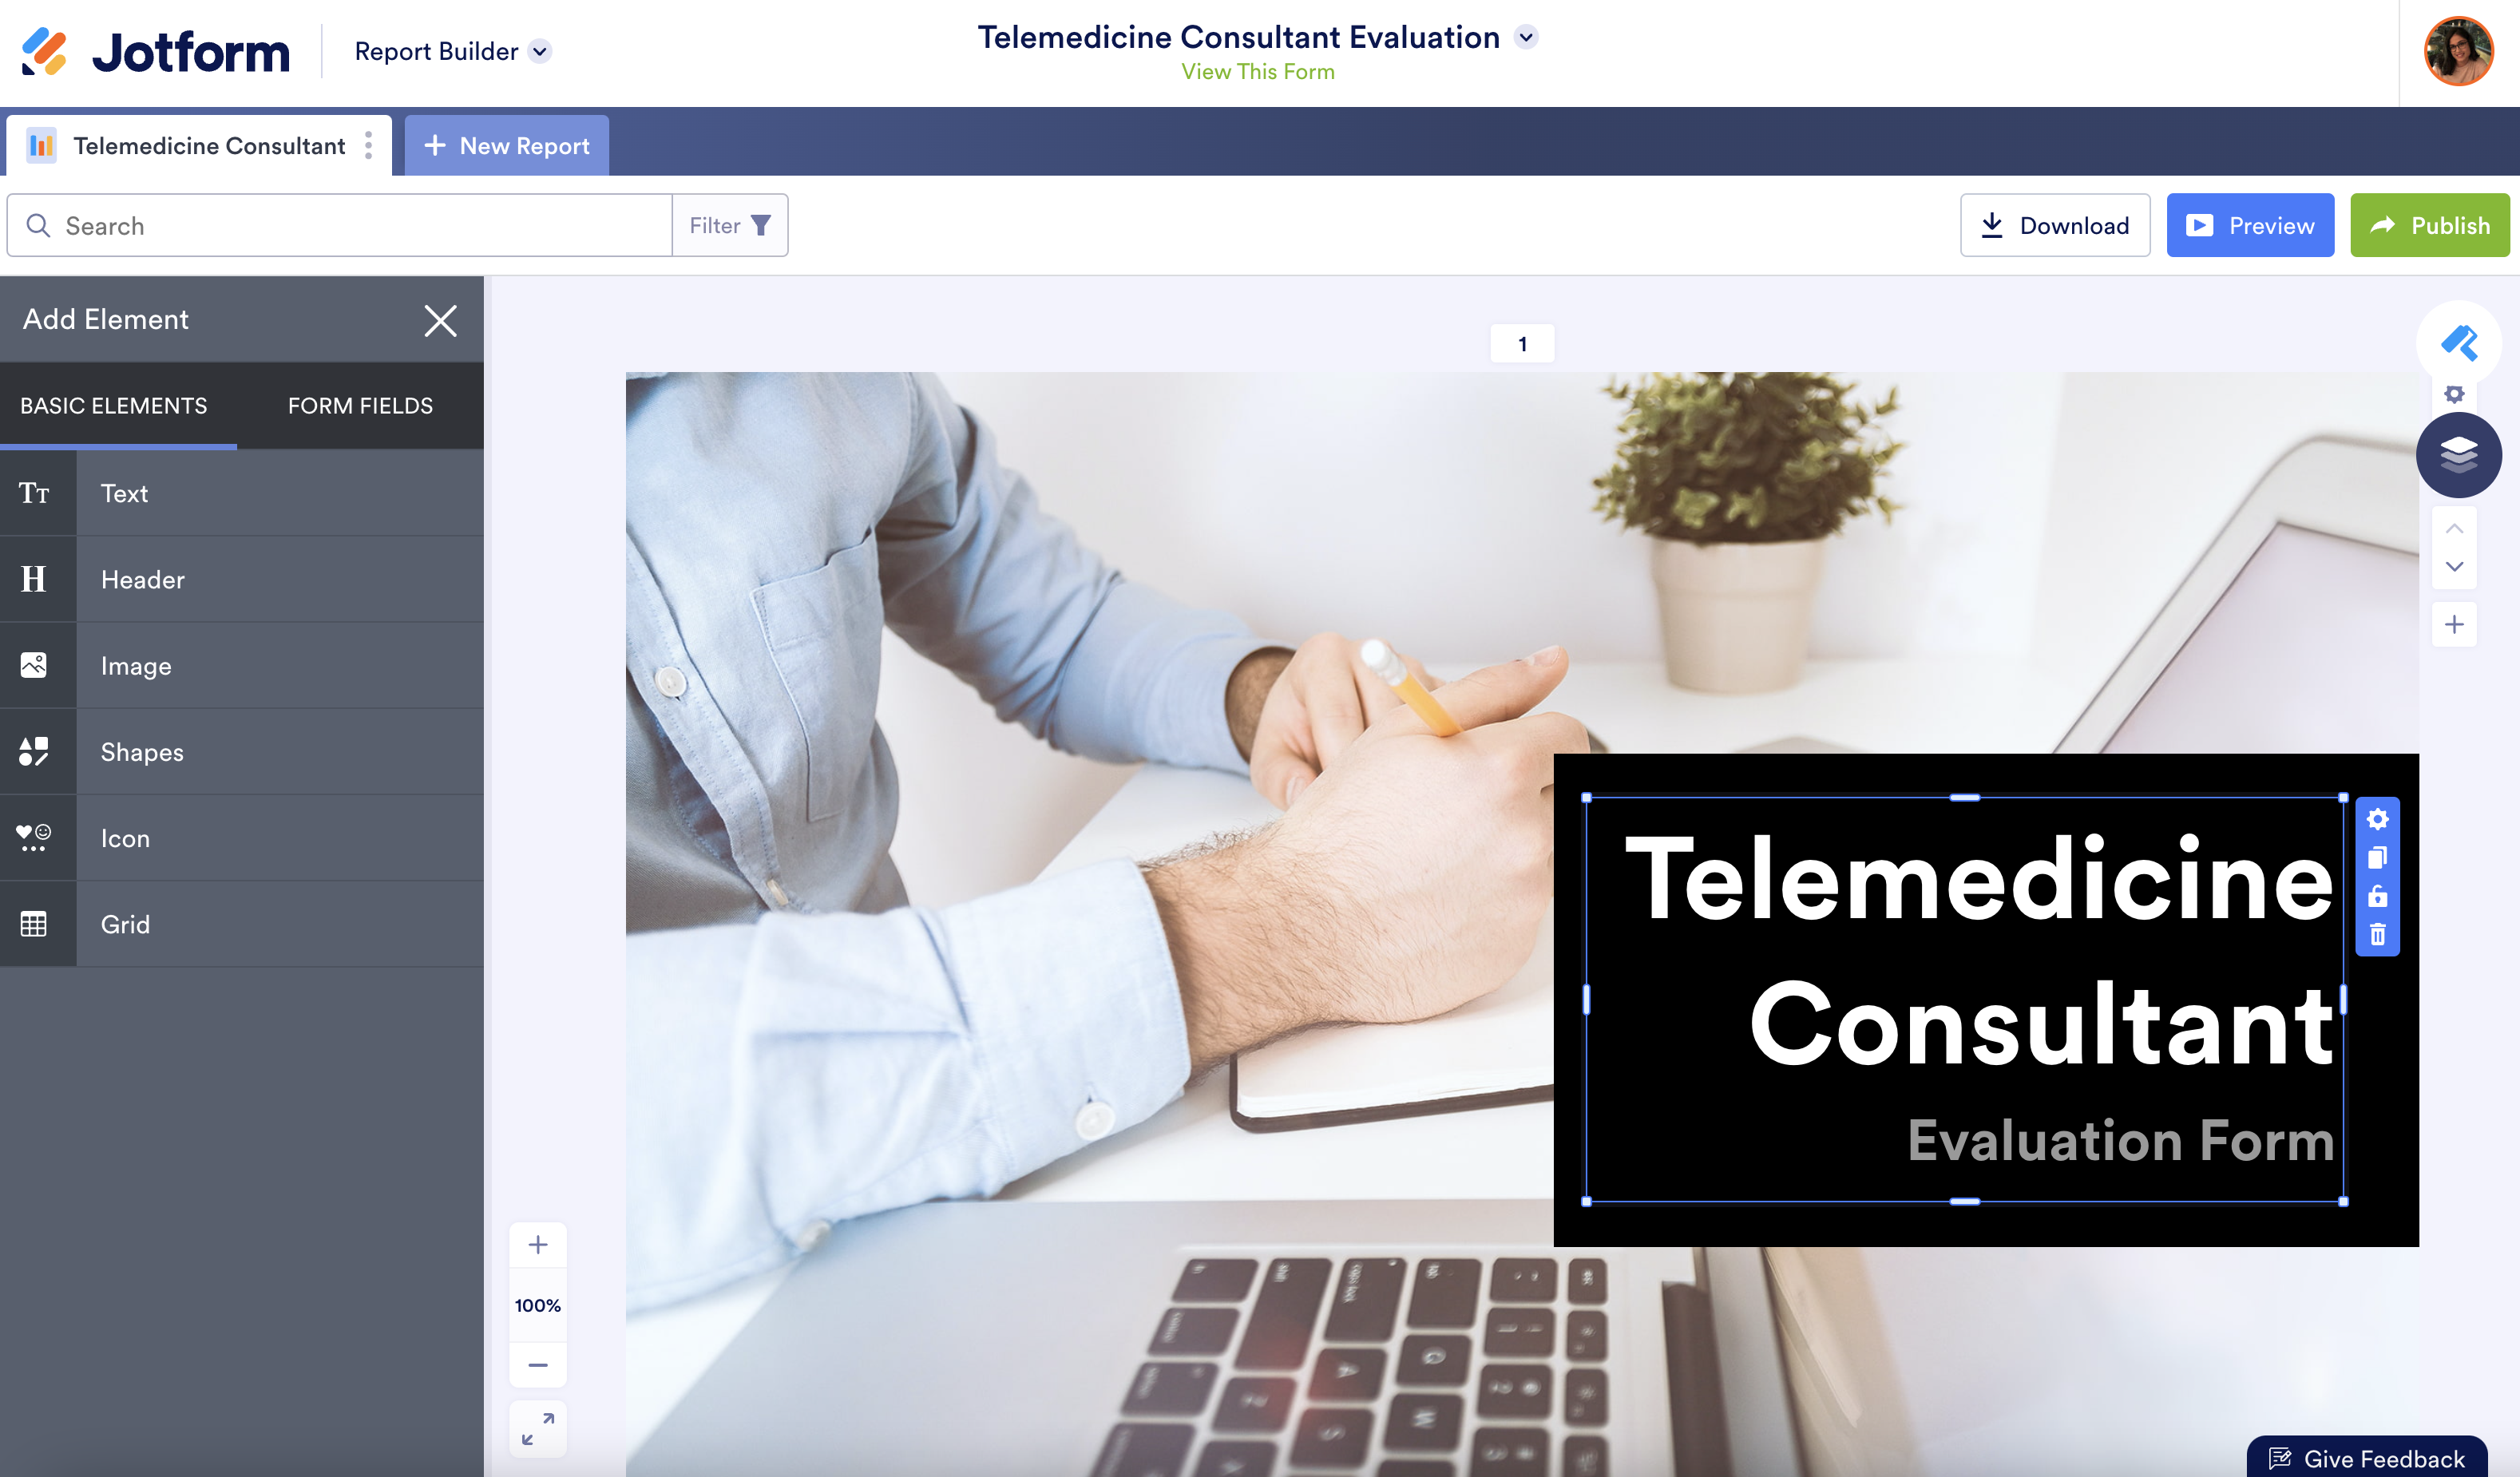
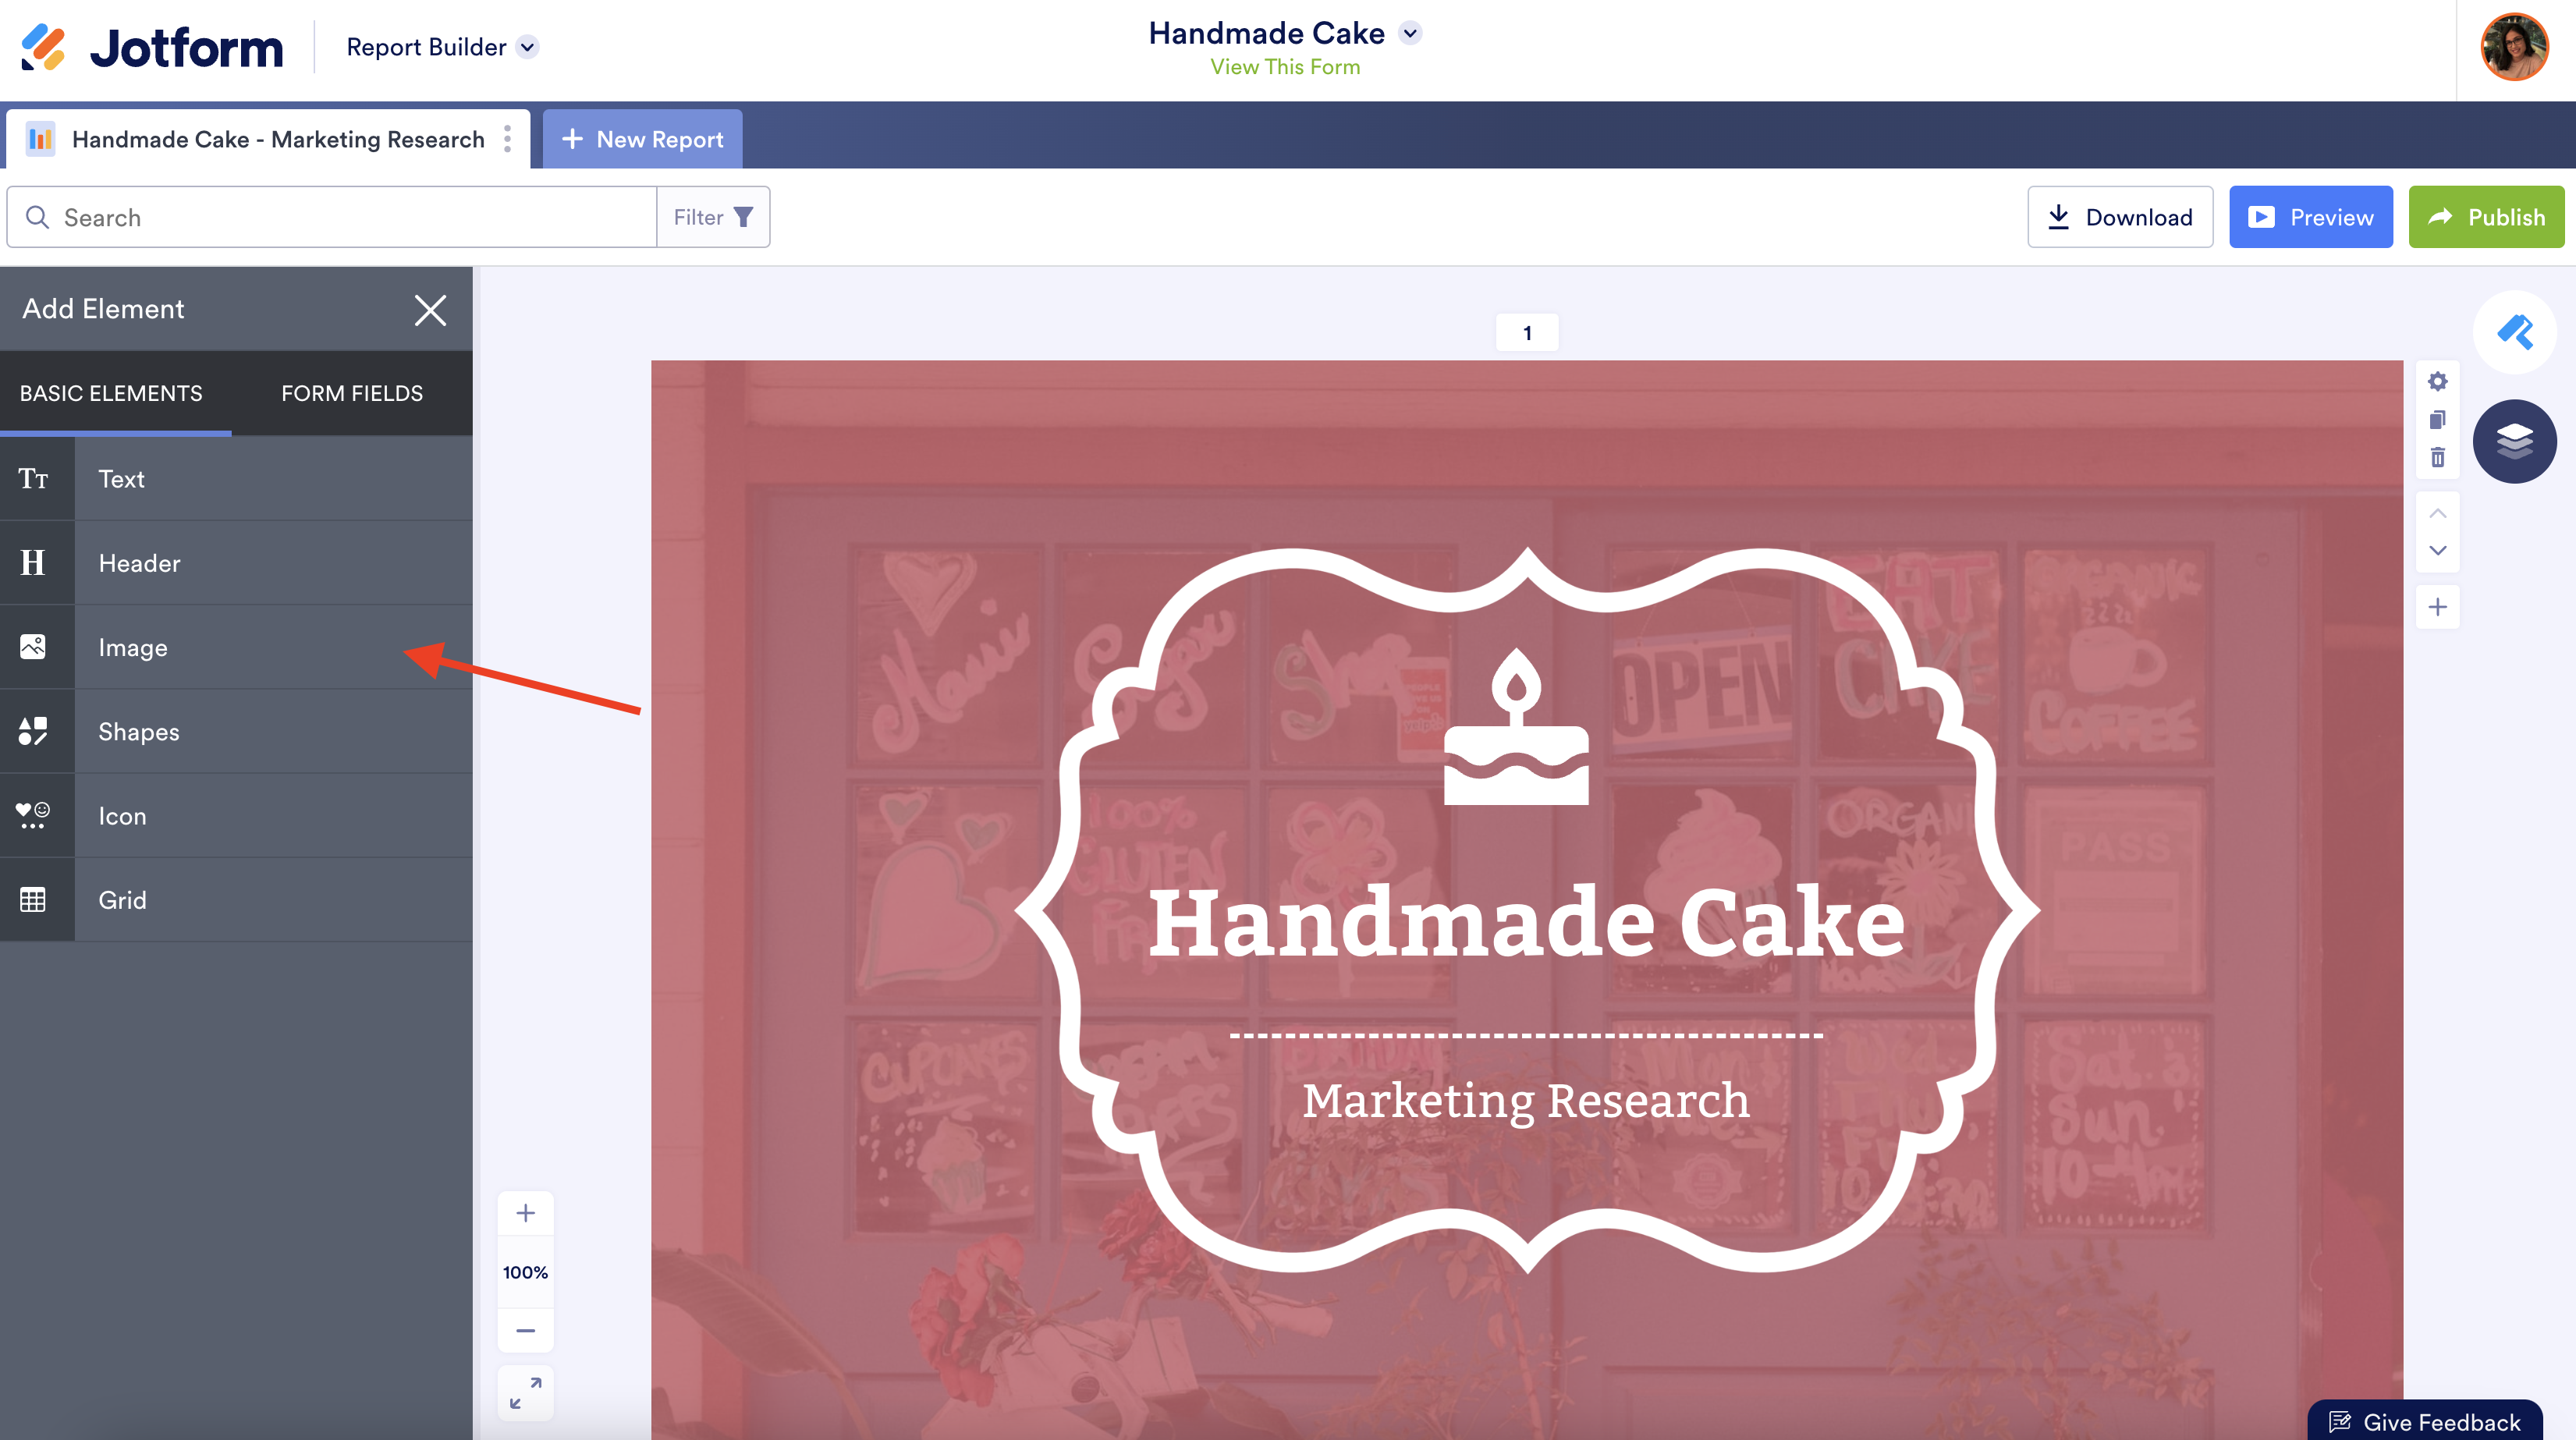
With a blank slate, you can change the font, set a background color, rearrange pages, and upload photos. Much like Jotform’s Form Builder, all you need to do is drag a graphic element onto your report and adjust the size or specifications to meet your needs.
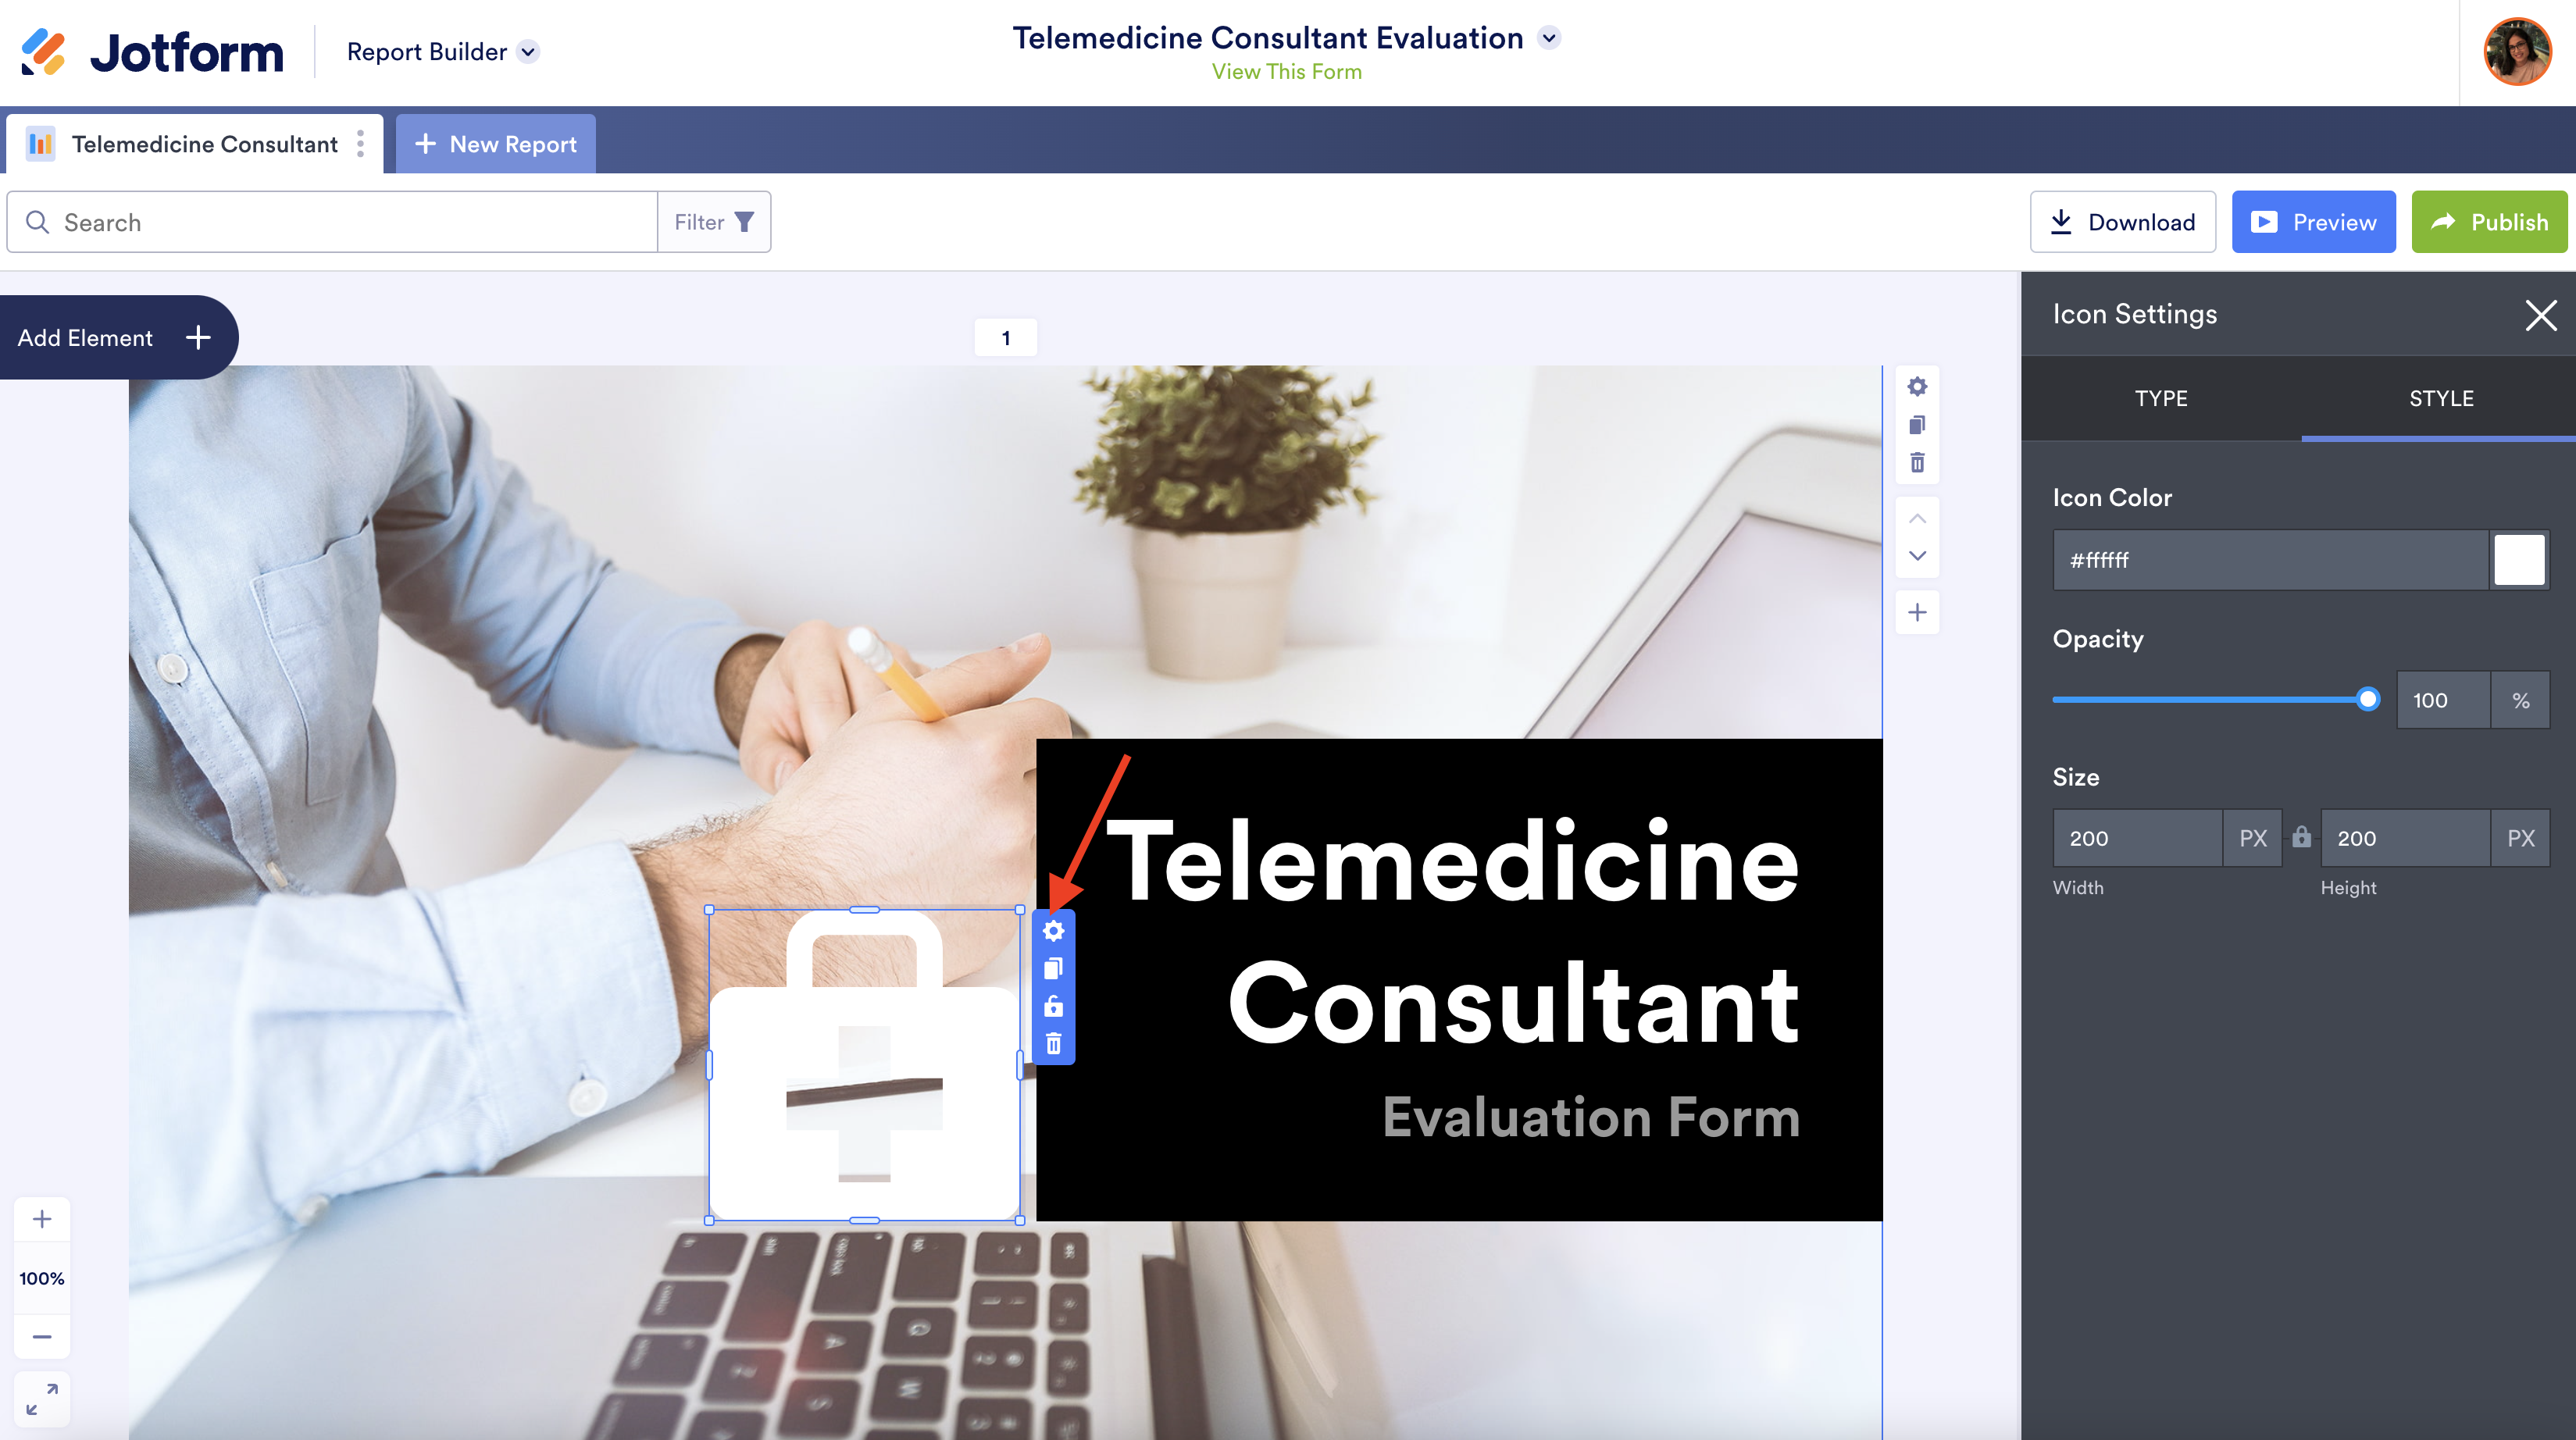
There’s even an option to add icons and shapes that let your report or presentation really shine.
Control how data is displayed on your report
Data can help you tell a great story or make a persuasive argument, but doing either will be difficult if the information isn’t presented well.
Whether you’re building a report from scratch or generating one from a template, Jotform Report Builder ensures that your message and the data that accompanies it aren’t confusing, misinterpreted, or lost in translation.
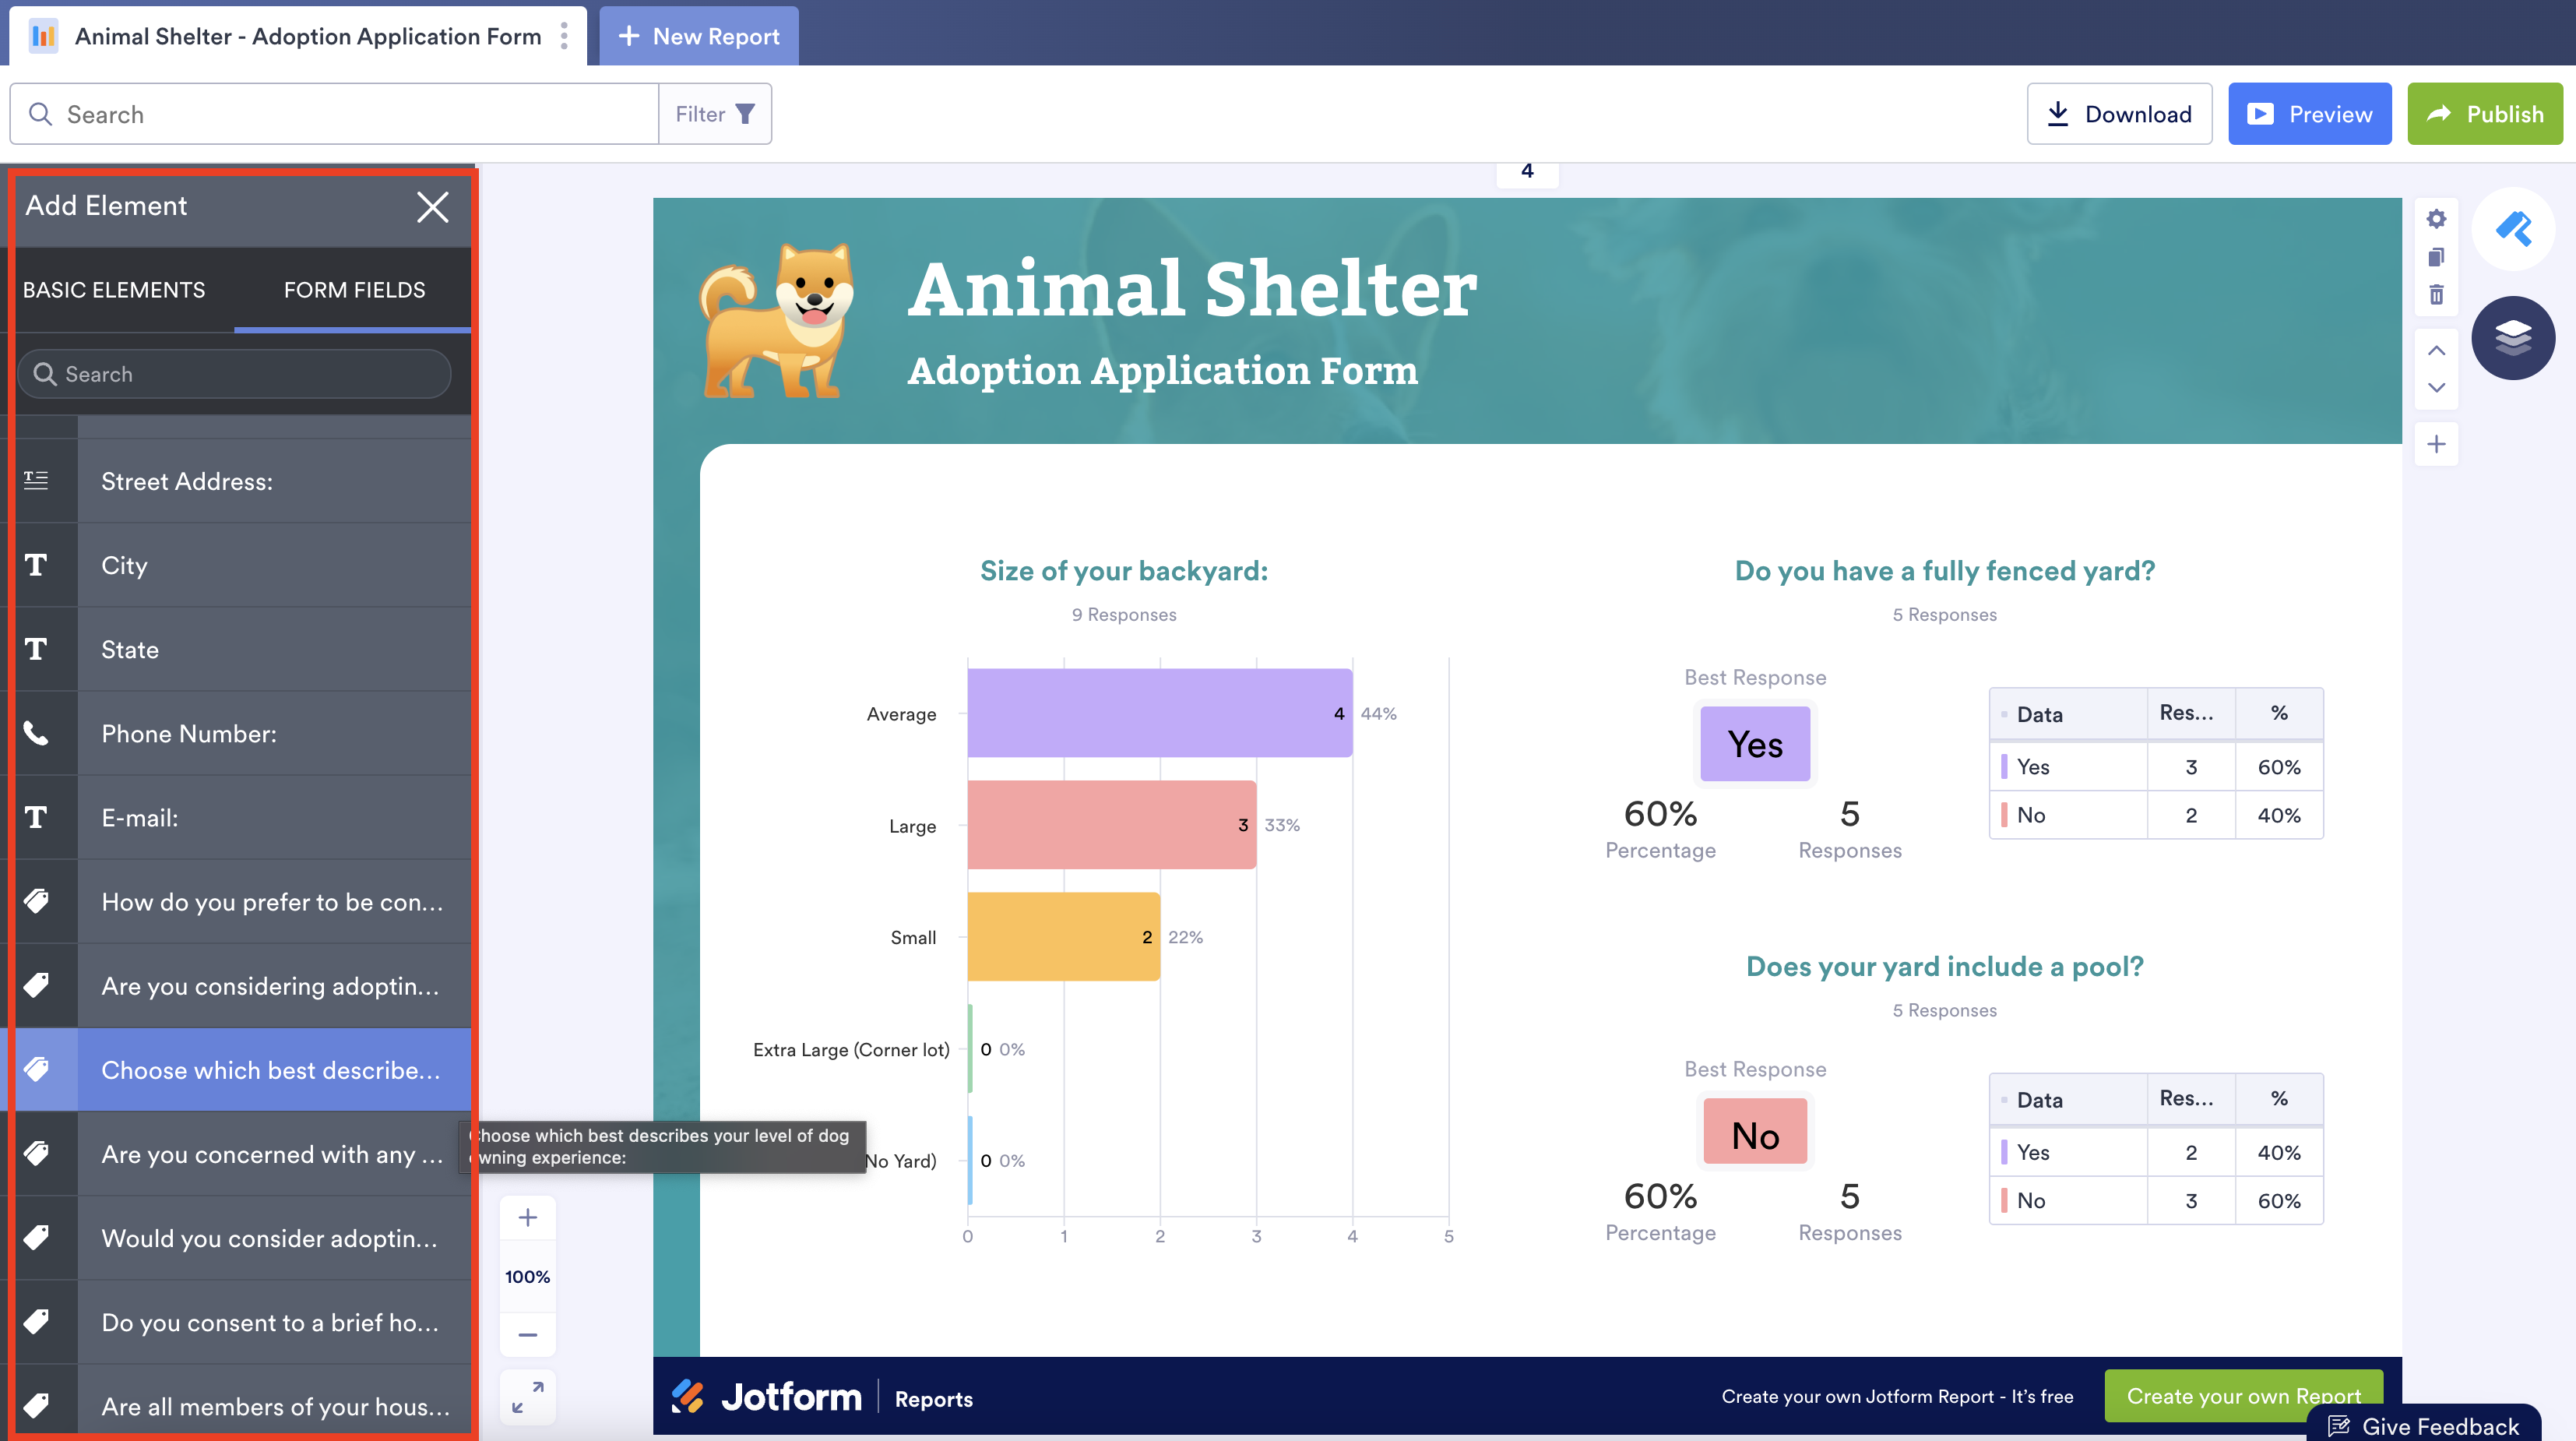
When you drag questions from your online form onto your report, data from submitted responses will be displayed as a graph that you can modify to meet your needs. If you have a lengthy online form, the handy search tool in Jotform Report Builder can locate a specific question and the submitted response data attached to it.
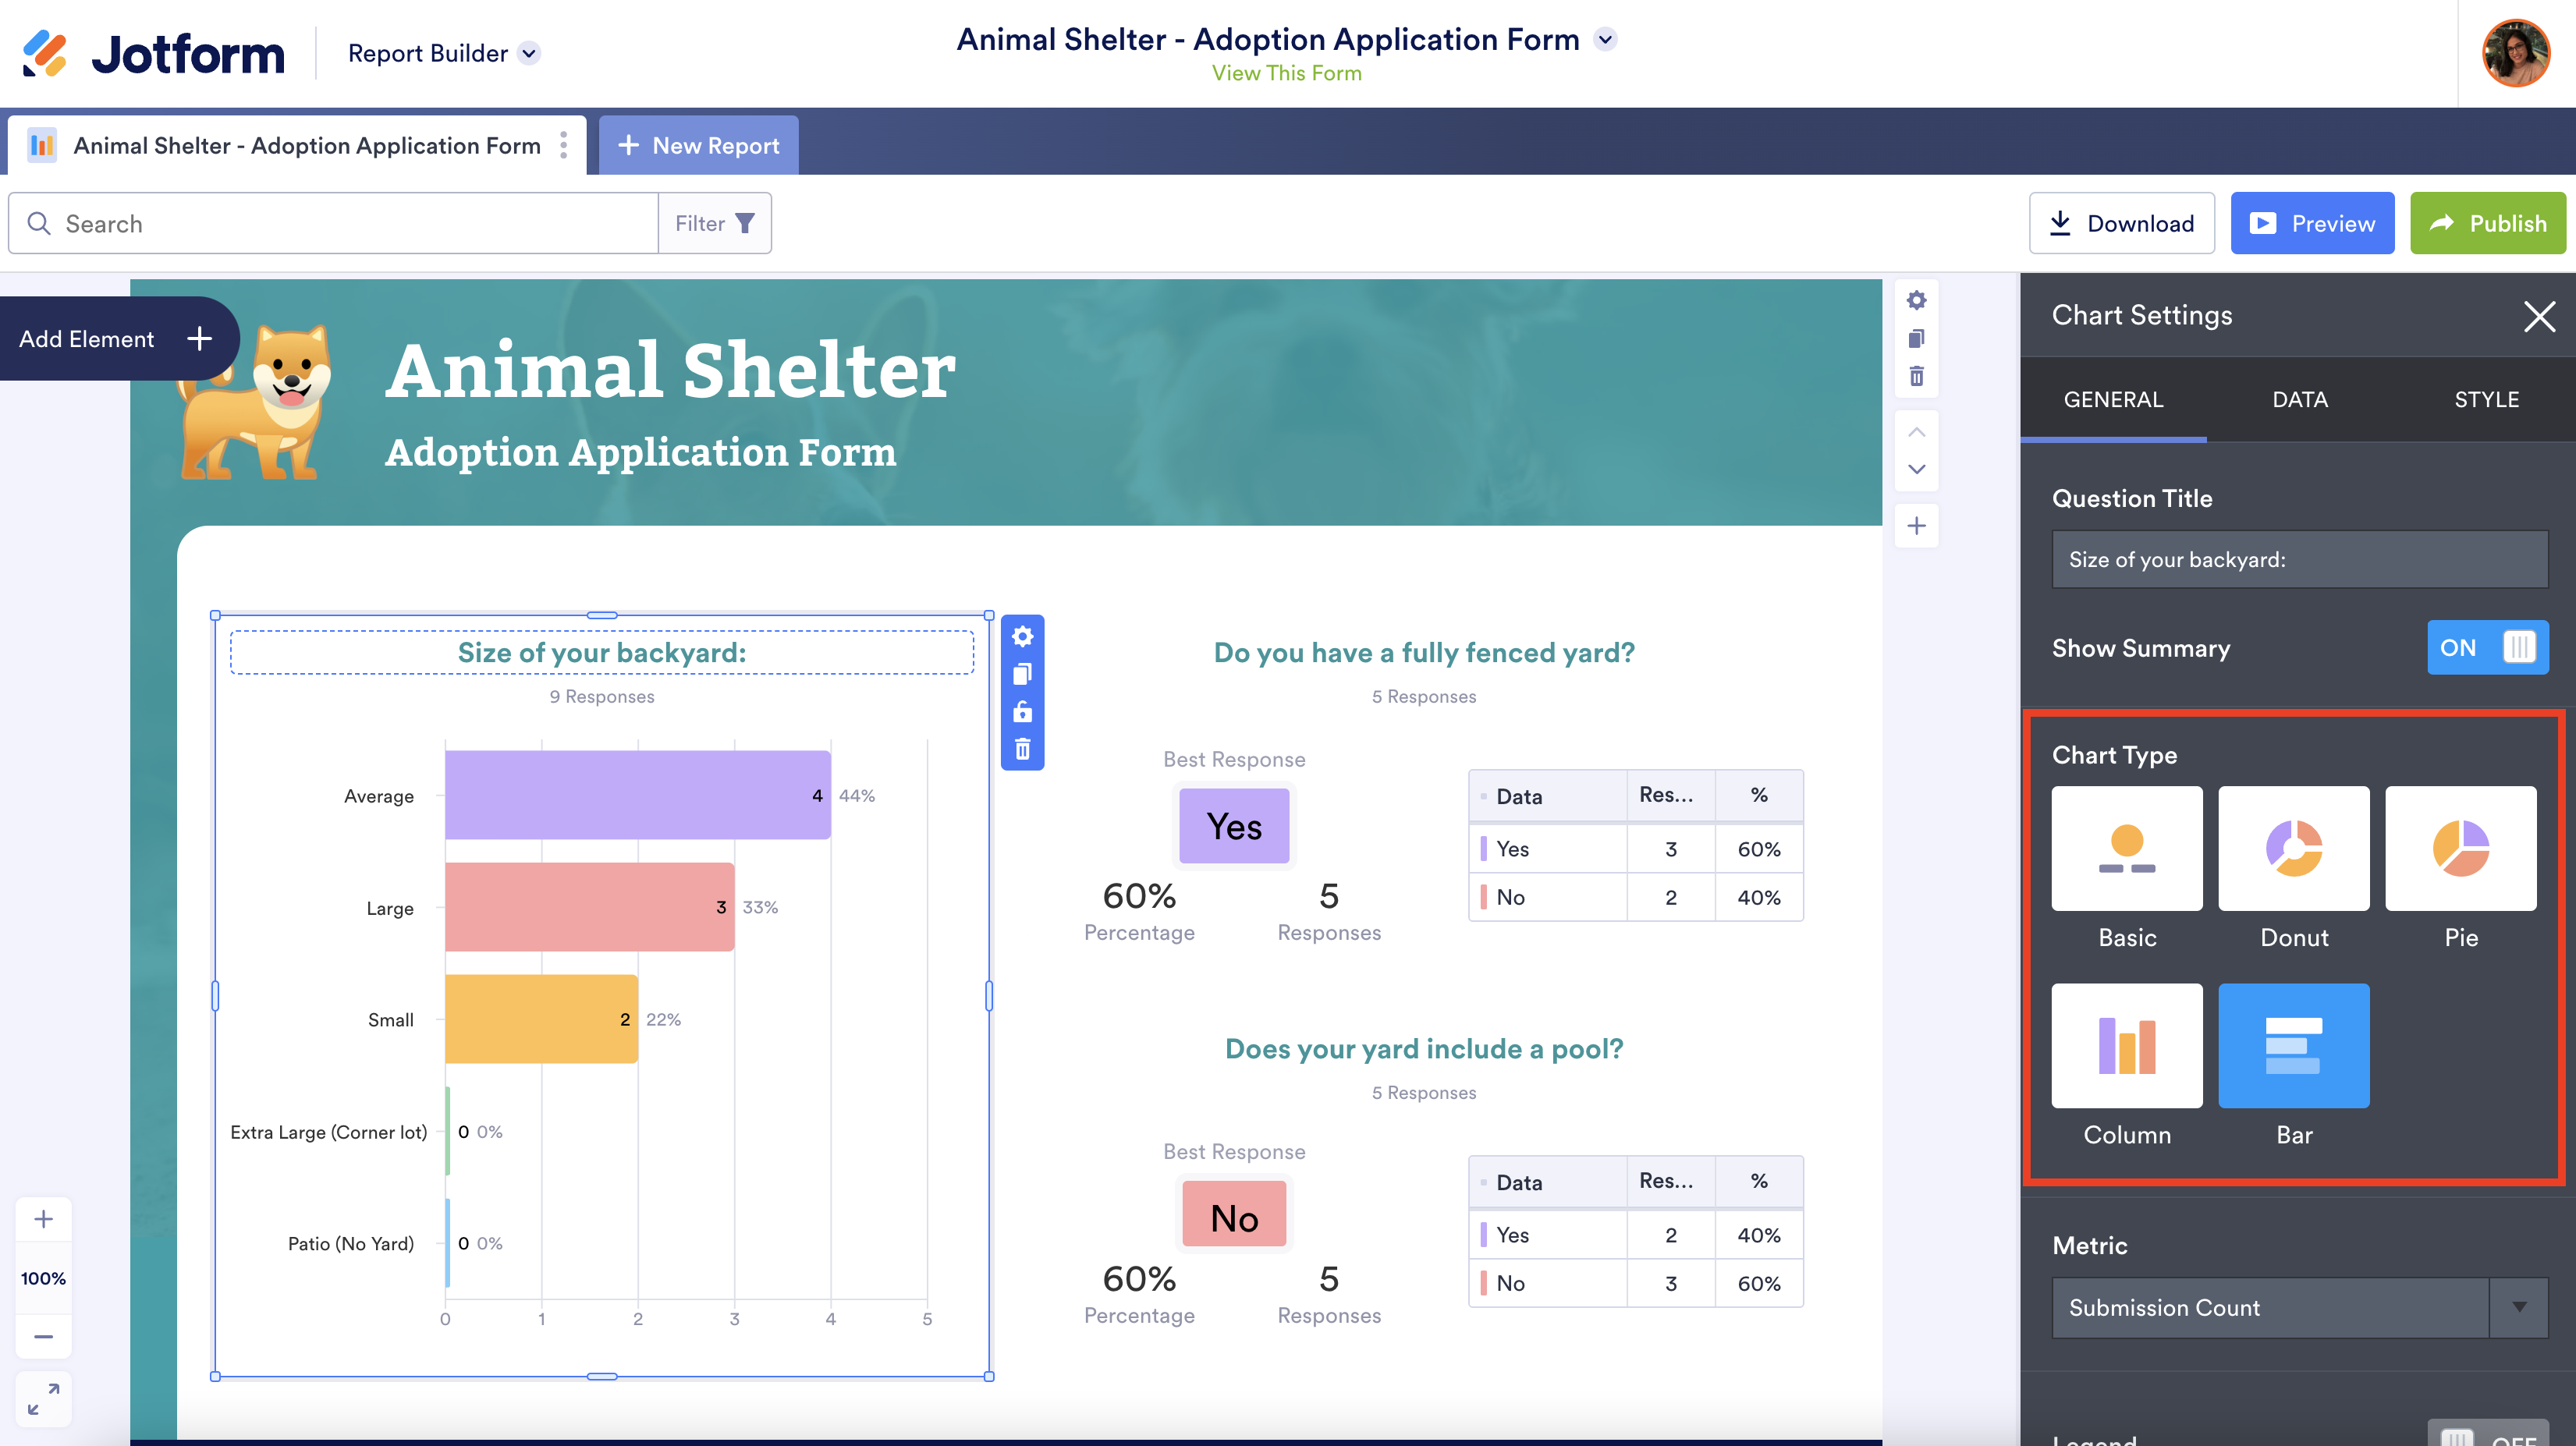
Although Jotform Report Builder uses certain graphs by default, you can easily change the graph to a donut chart, pie chart, column chart, or bar chart instead. You can also include a graph legend or table grid to ensure your data is displayed clearly and isn’t misinterpreted.
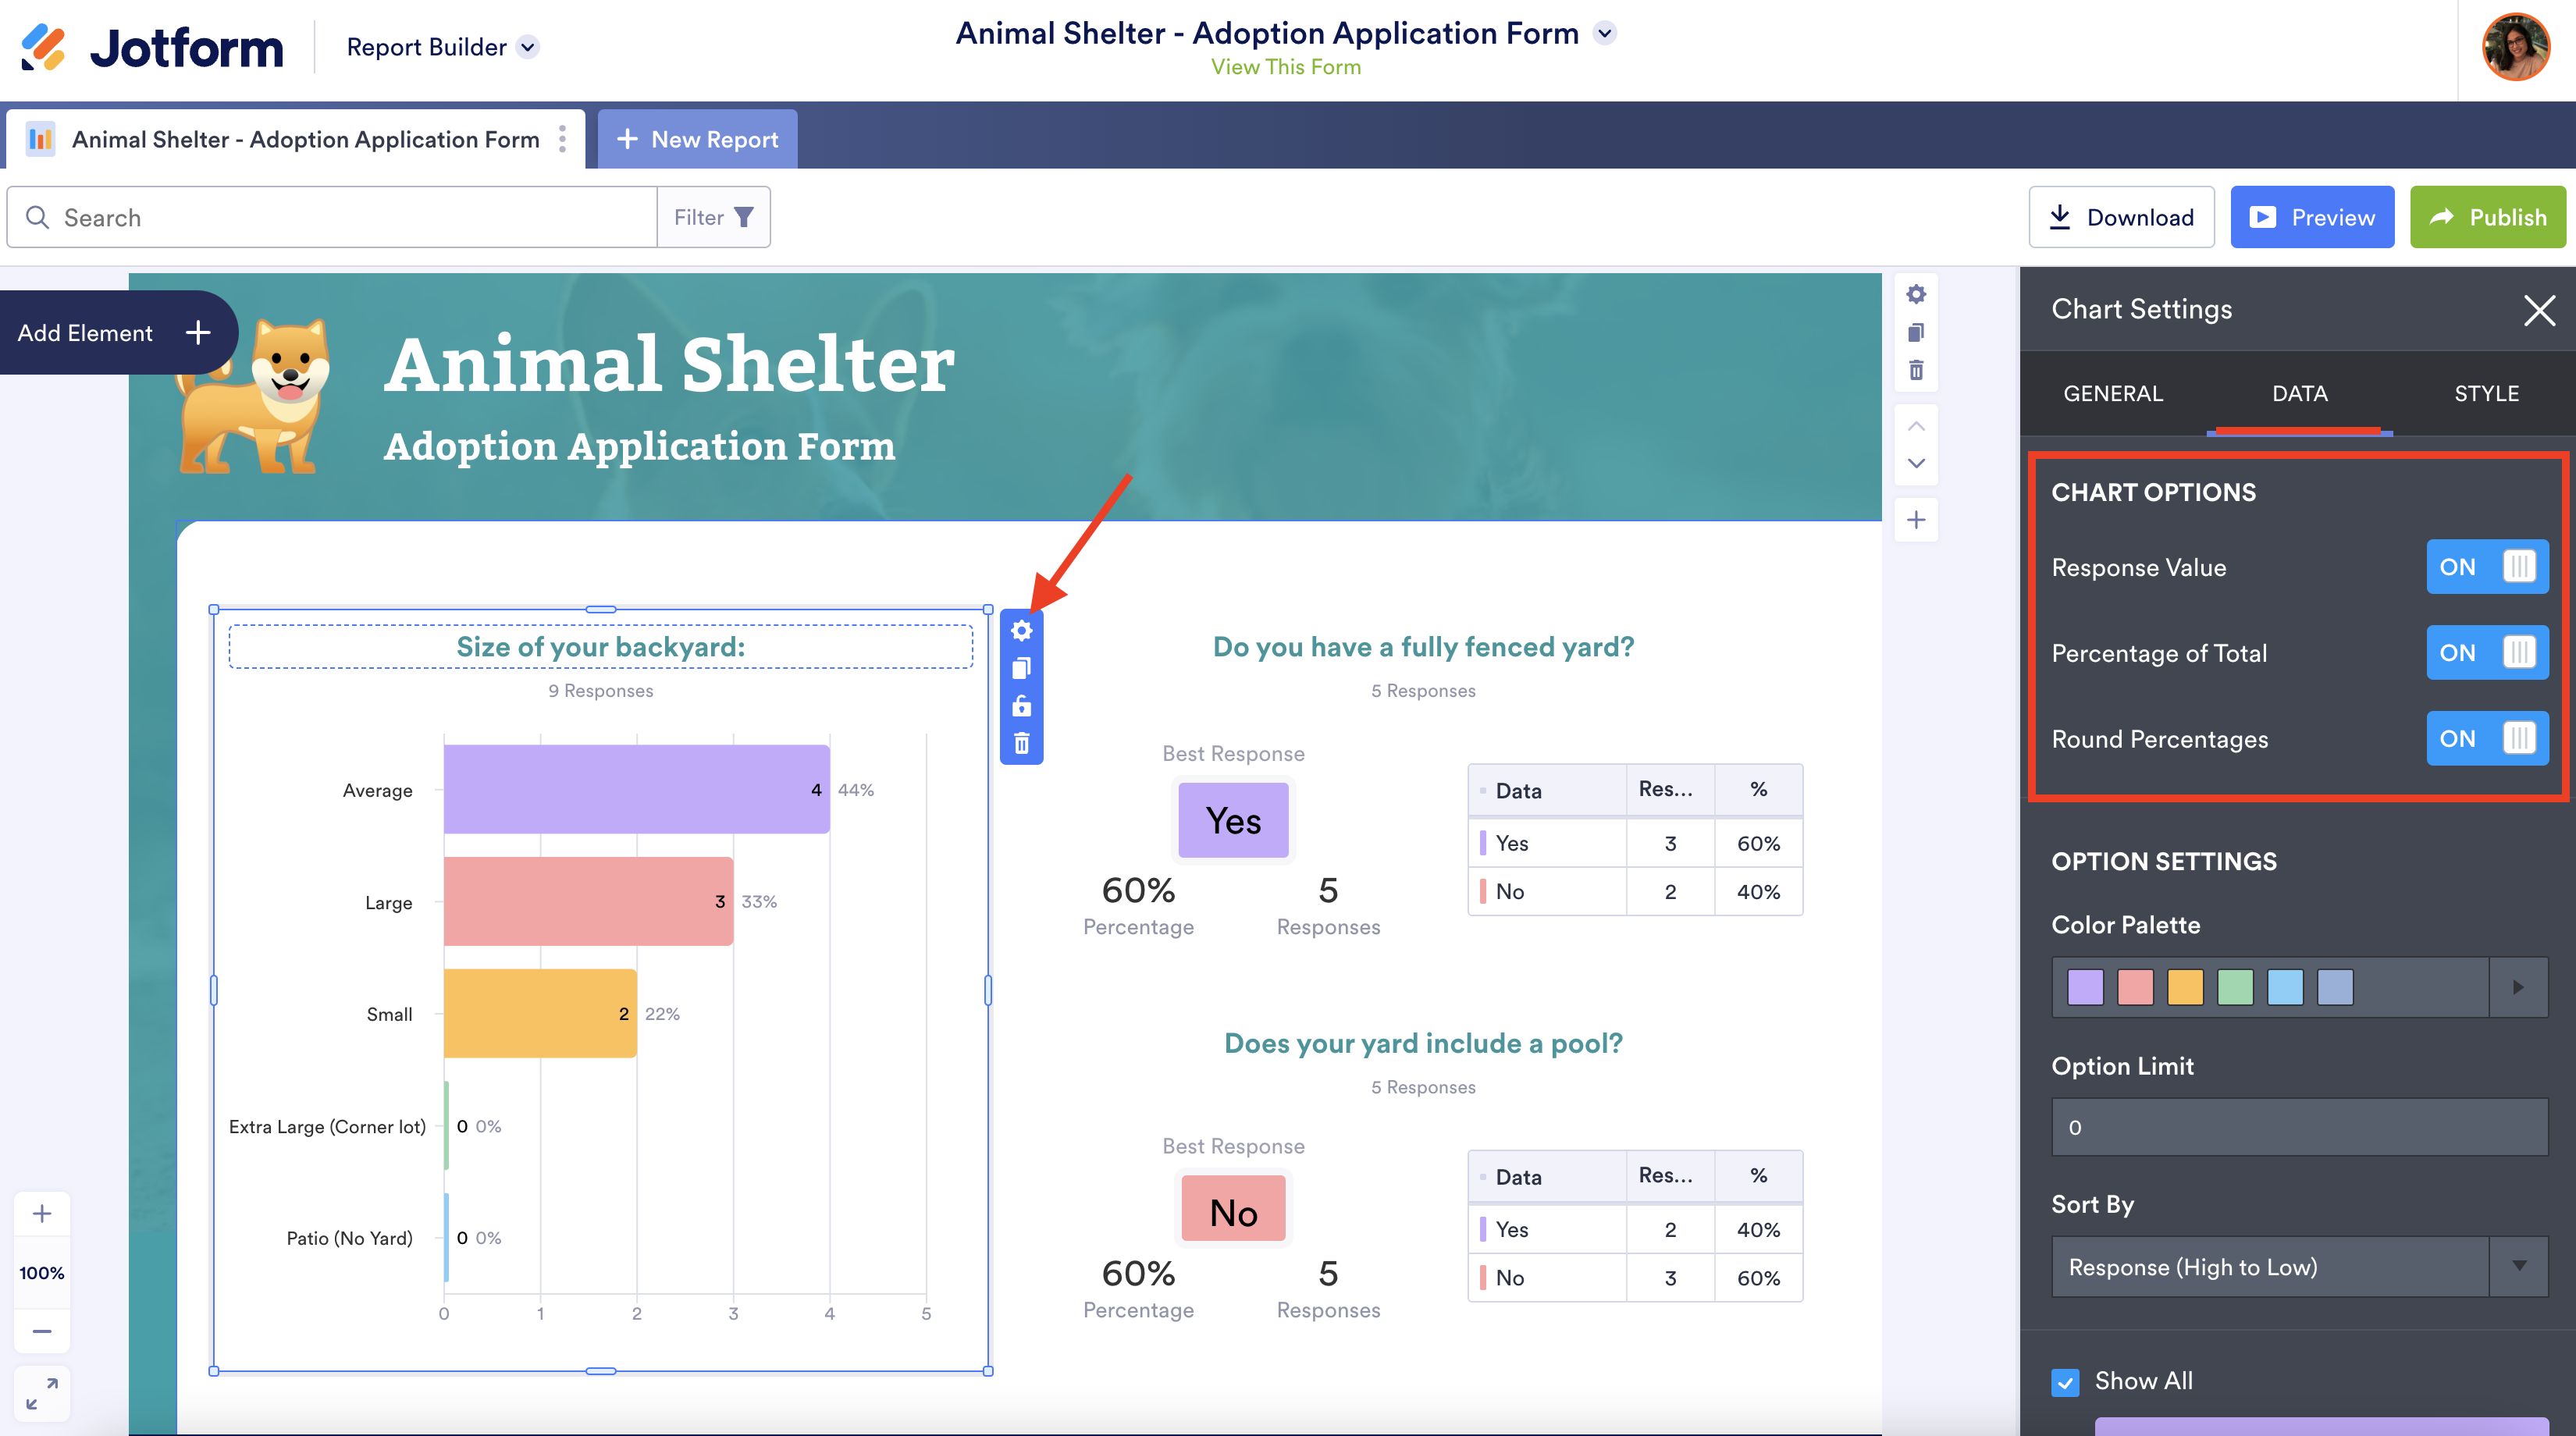
Jotform Report Builder can also help you further clarify data by illustrating how responses to online form questions are distributed, using percentages and whole numbers.
Add a business logo to personalize your report
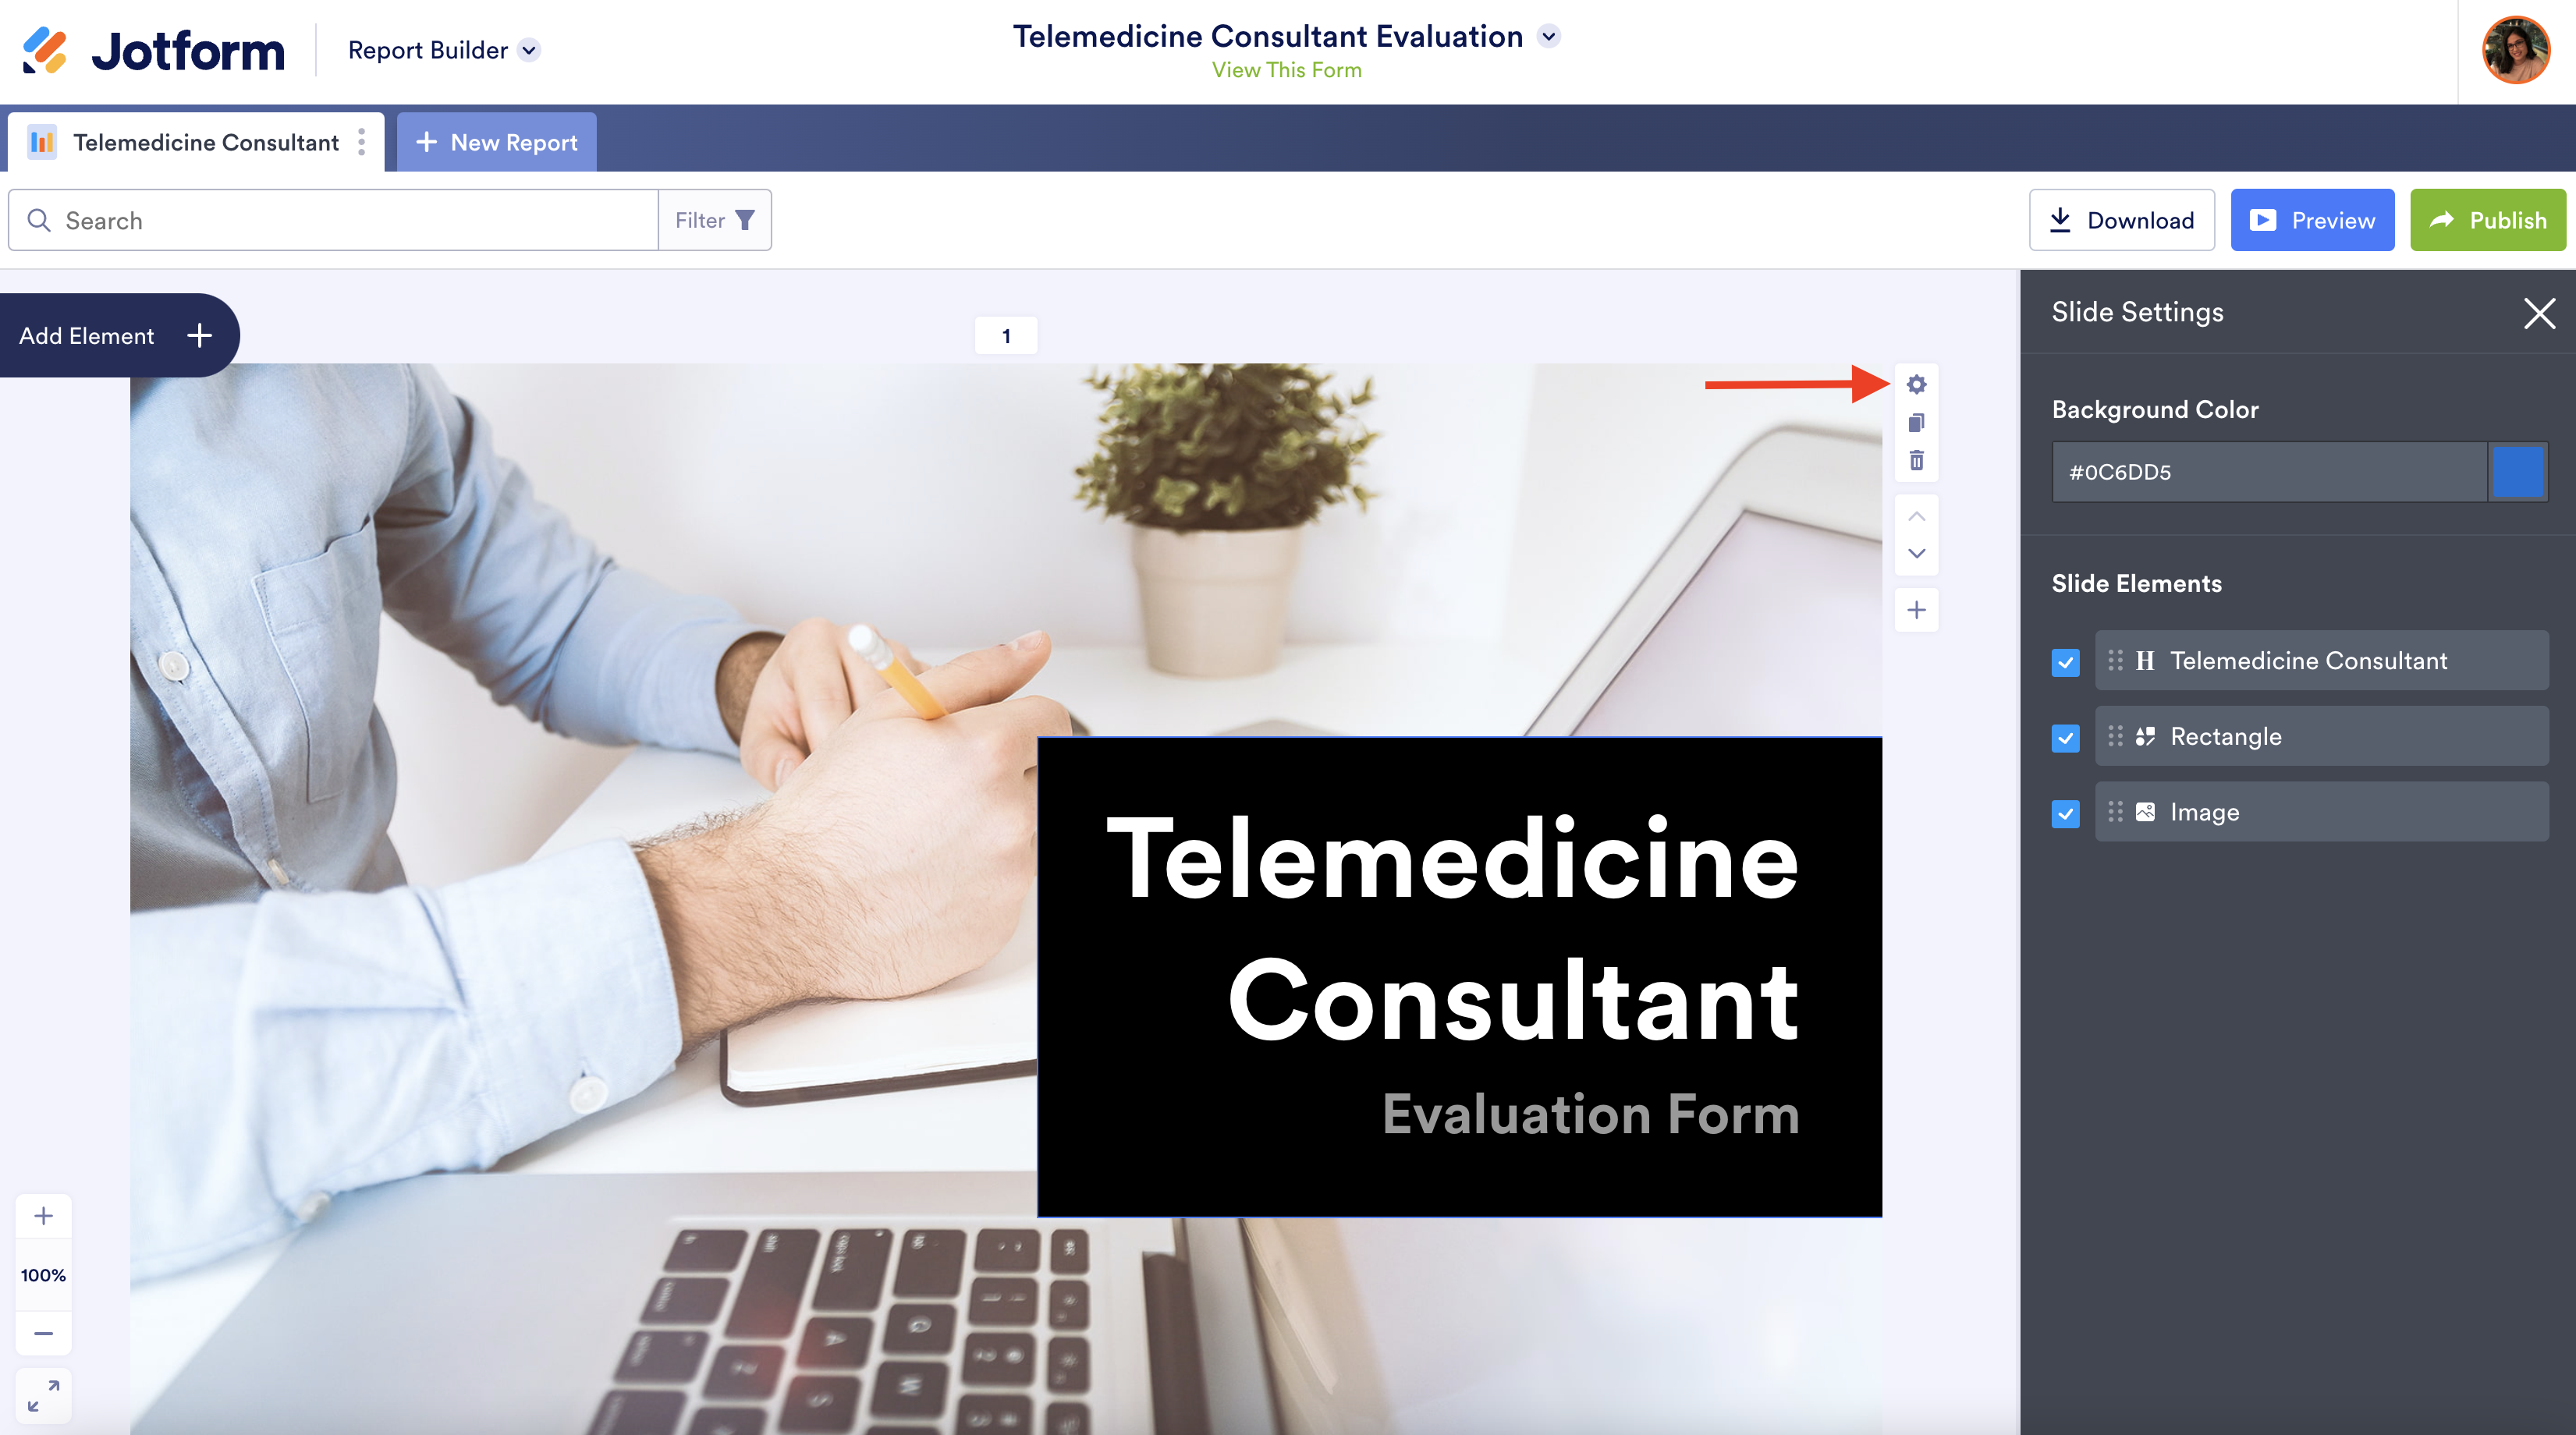
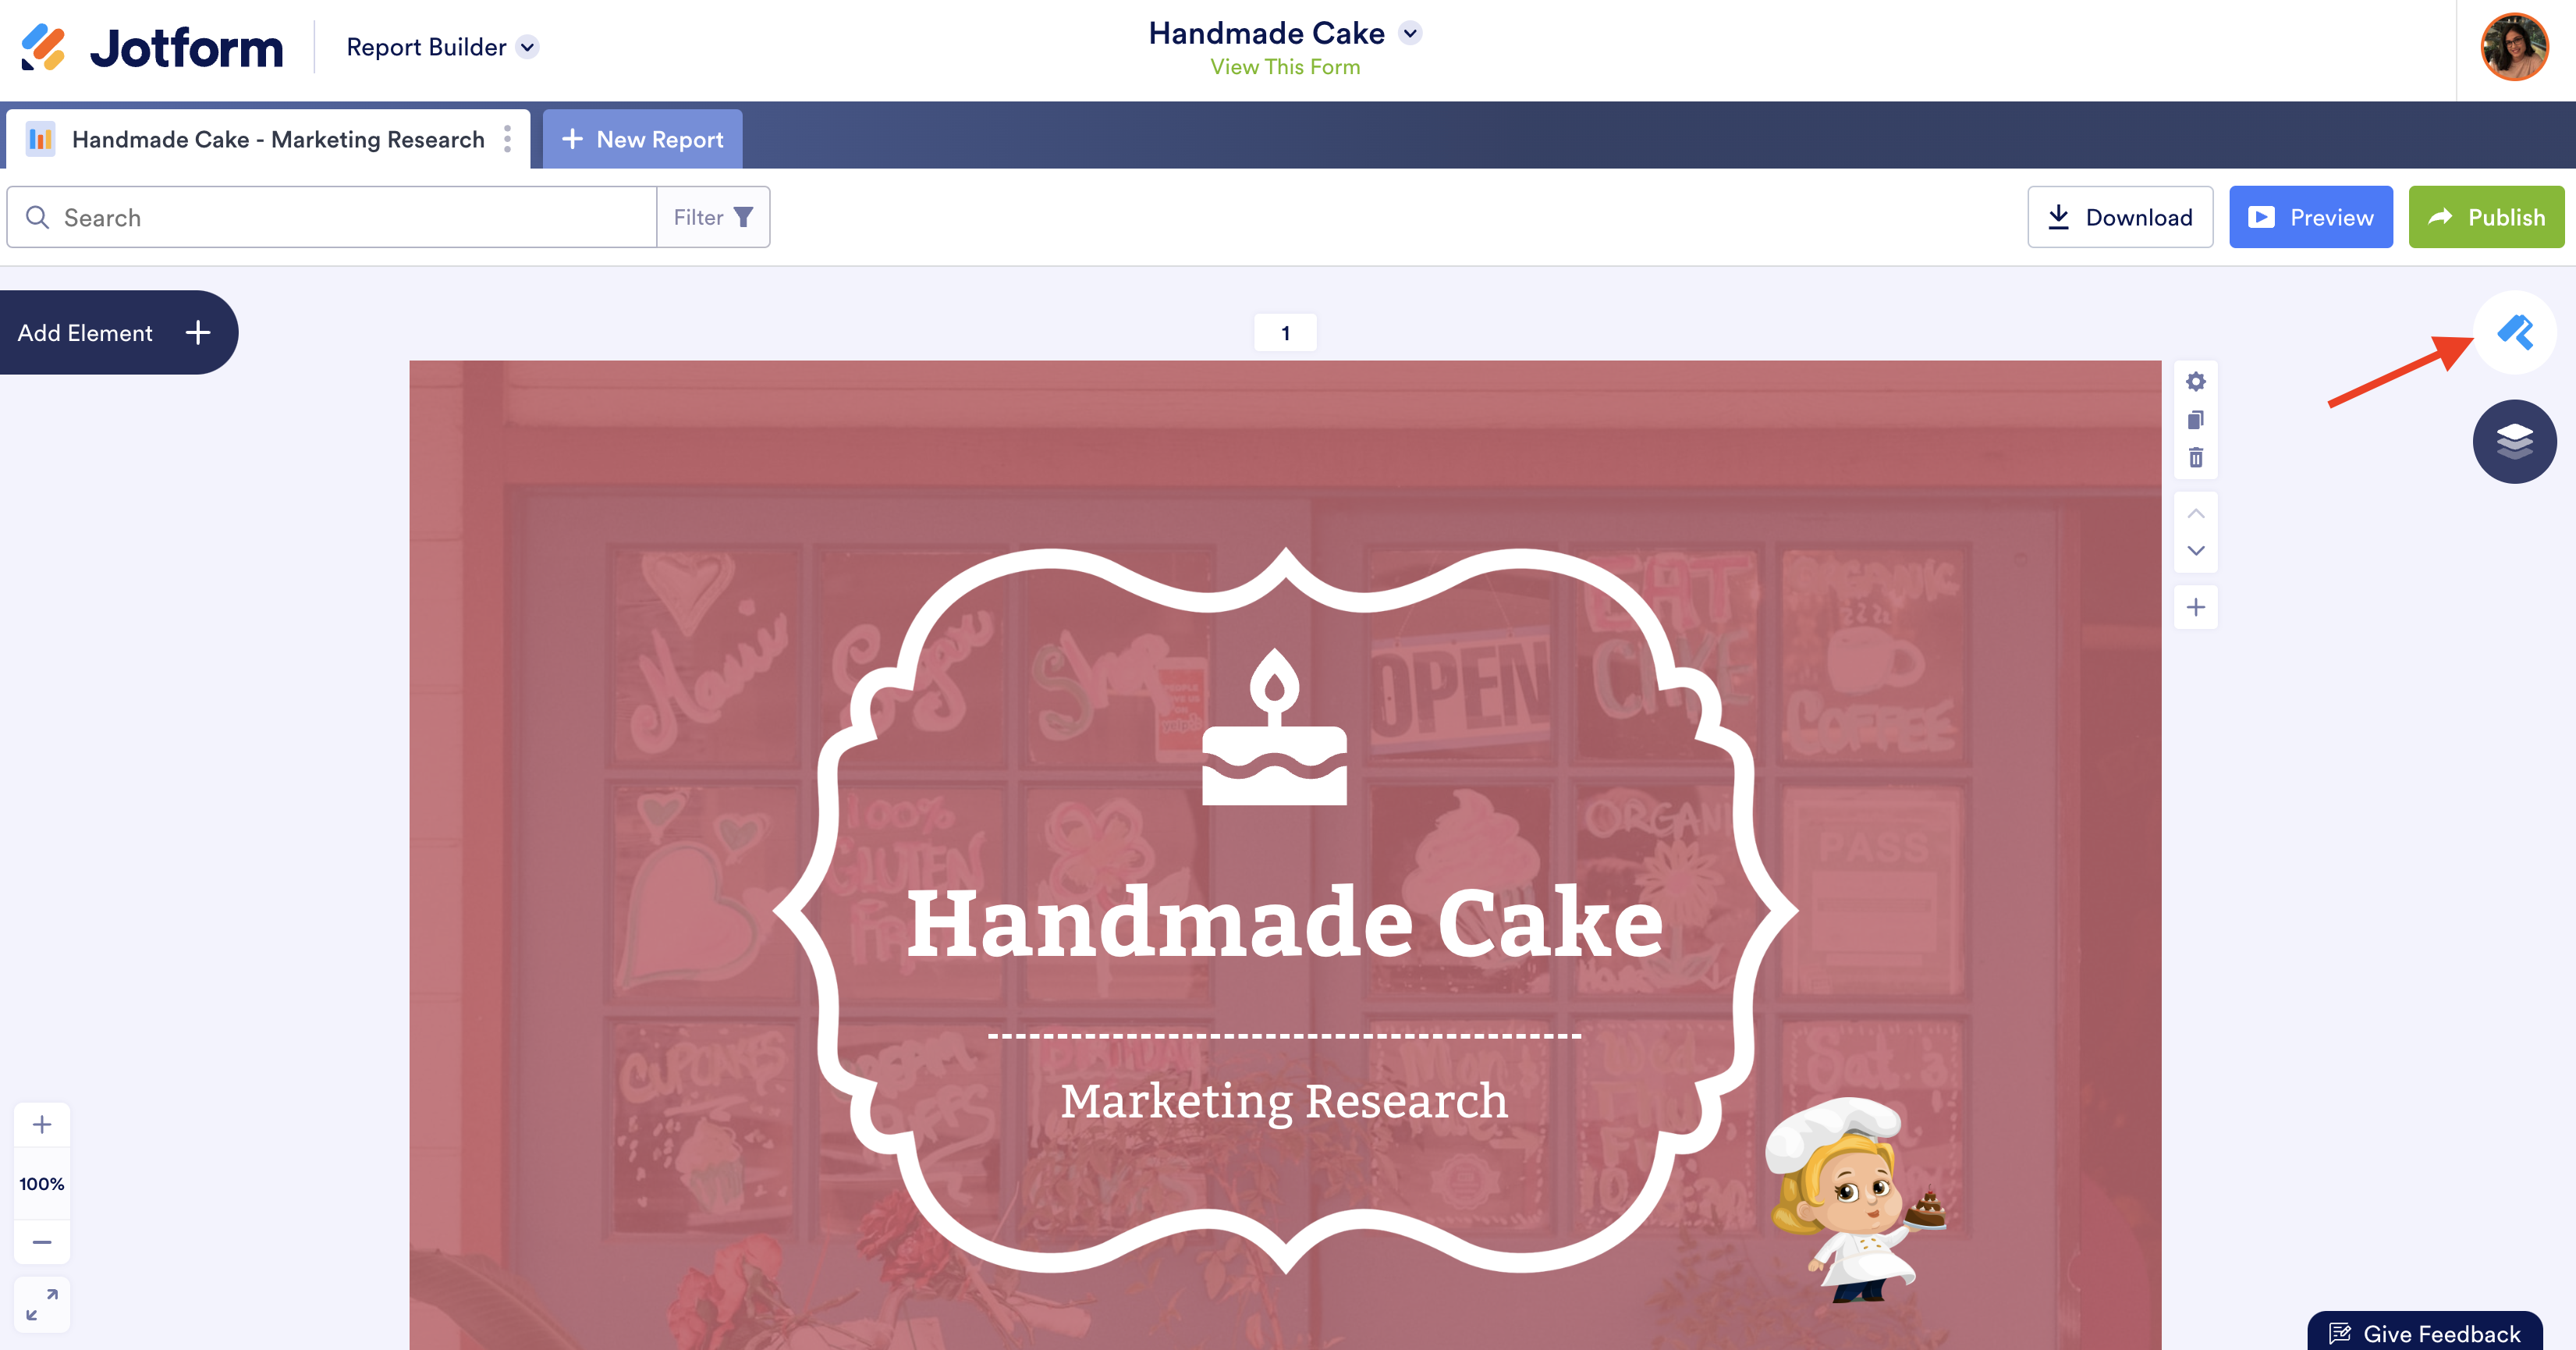
Jotform Report Builder makes it easy for you to upload a business logo to your report in a matter of seconds.
Apart from uploading business logos from your computer, you can also choose images that were previously uploaded to Jotform or directly linked to a specific website URL.
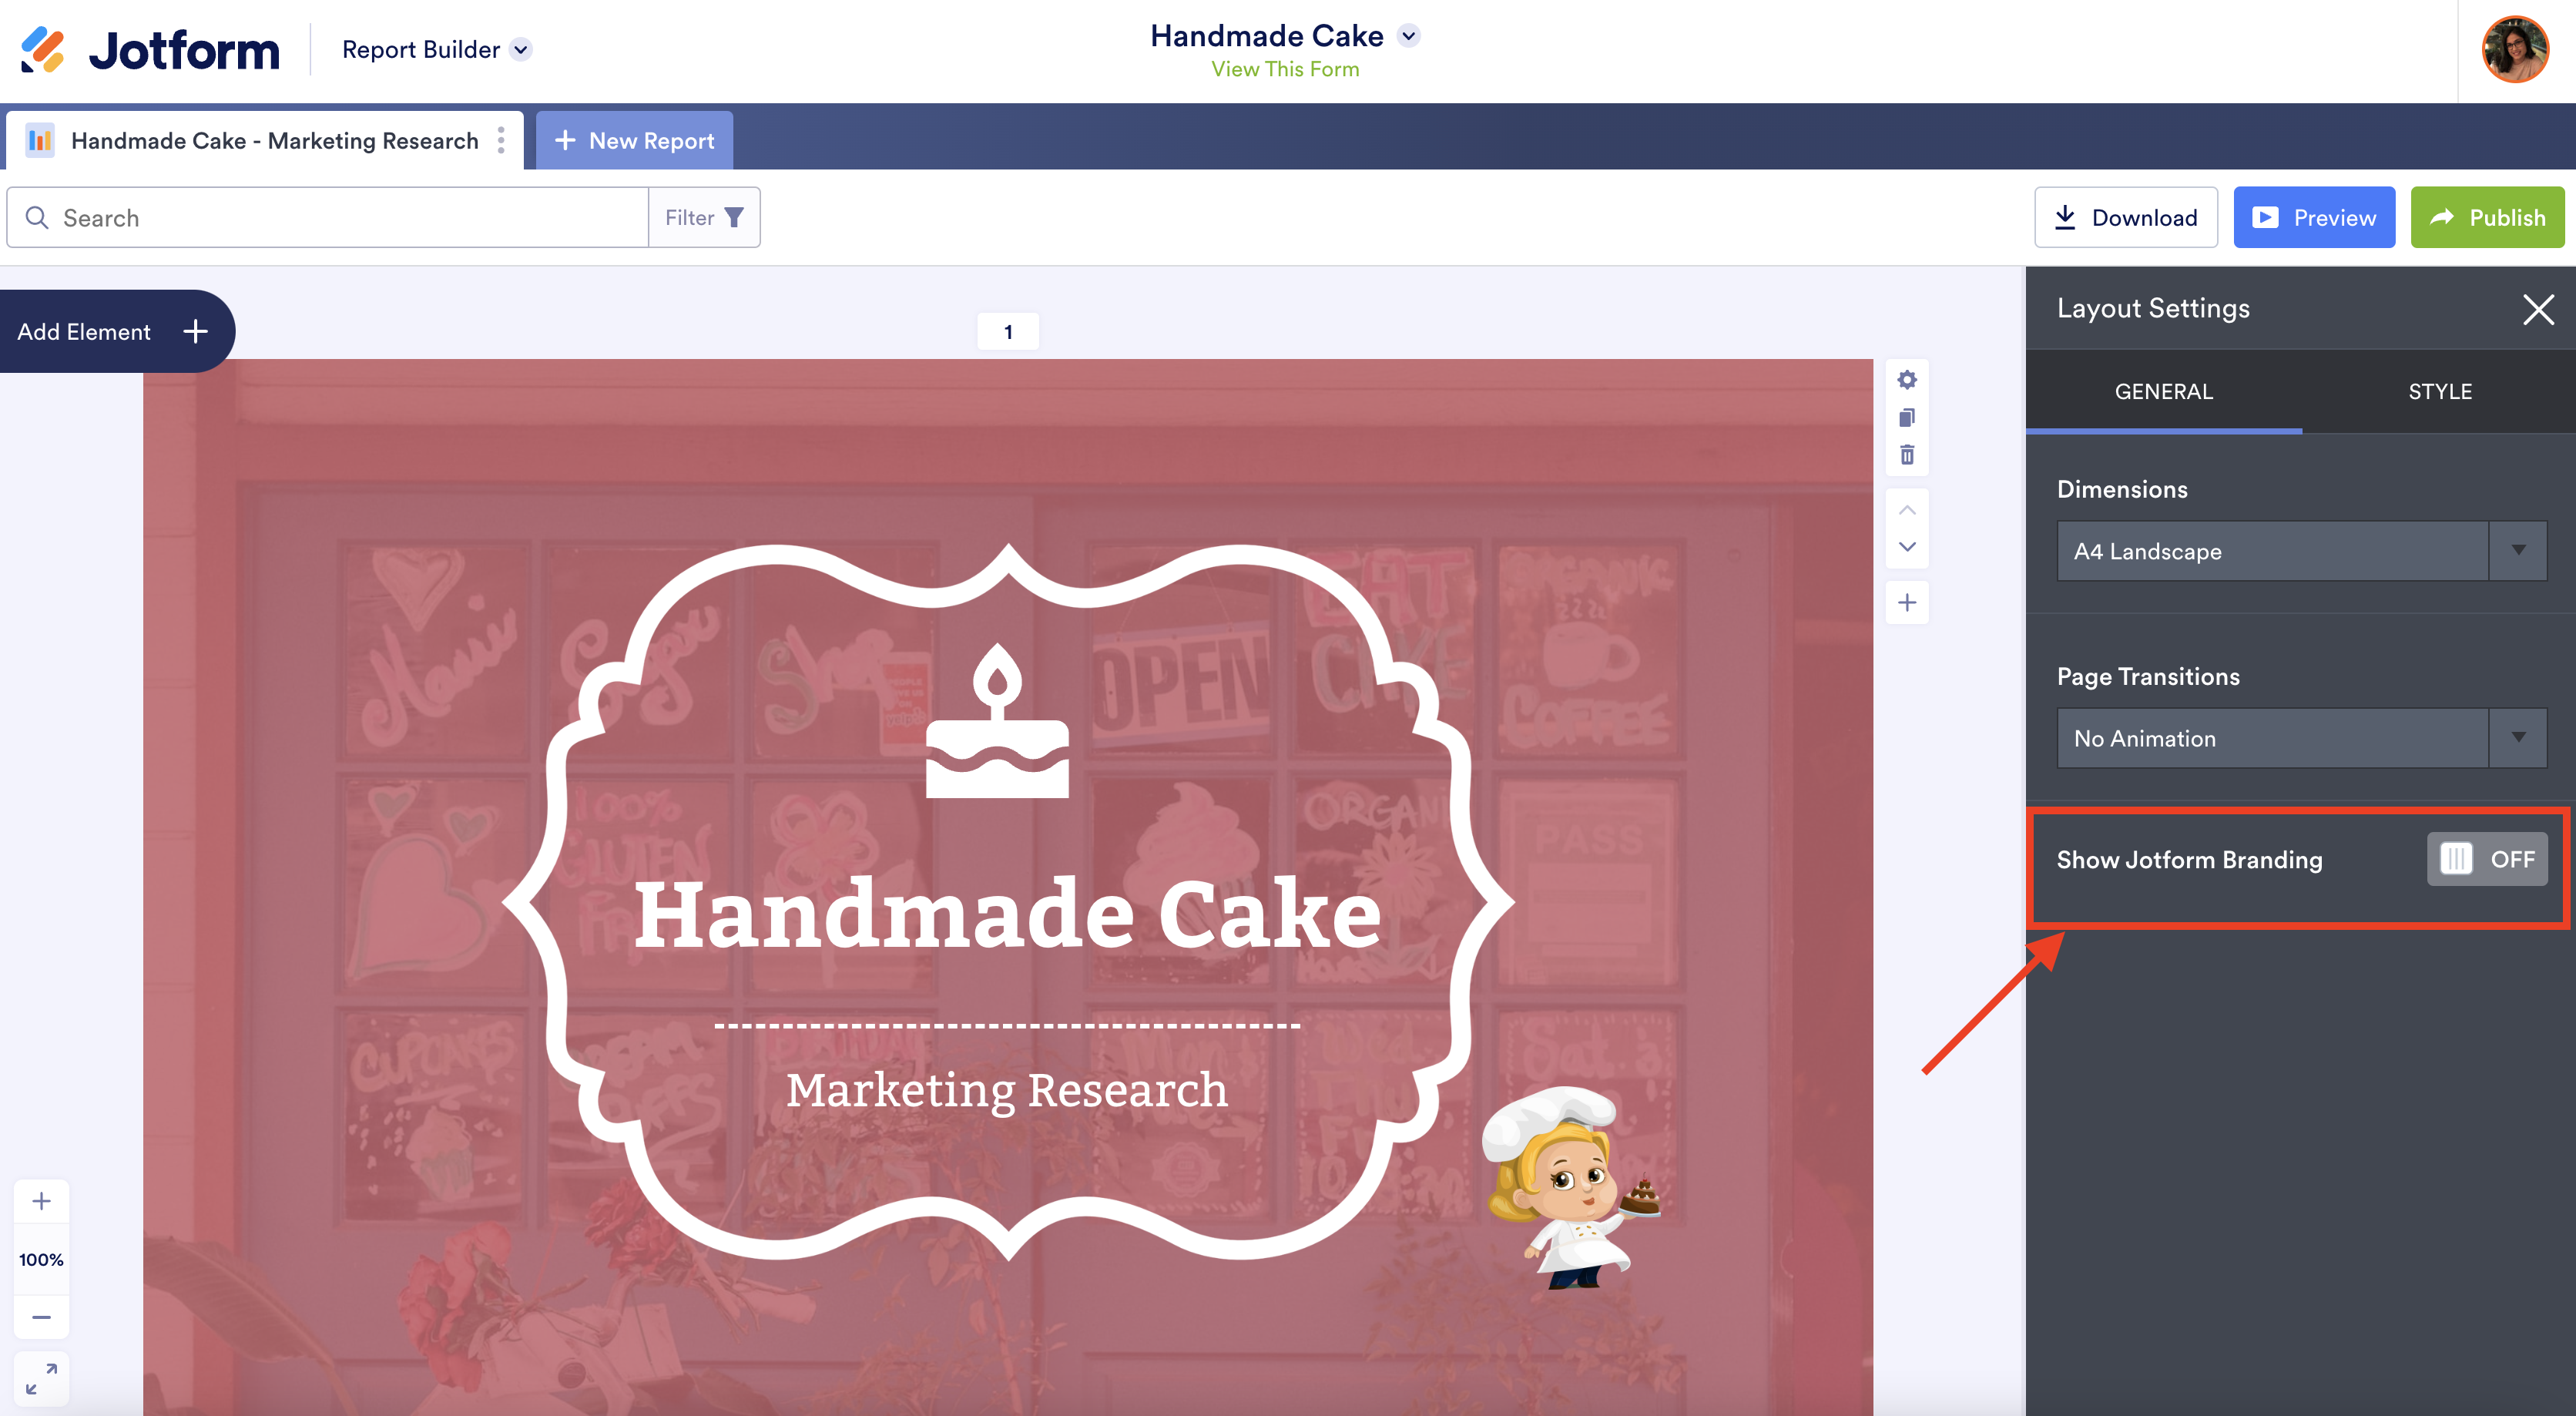
Once you’ve uploaded your business logo, you can resize and reposition it on your report. If you have one of Jotform’s paid plans, you can remove the Jotform branding that automatically appears at the bottom of your report.
Just so you know…
Only users with paid plans can remove Jotform branding from reports. Check out the wide variety of paid plans offered by Jotform. Jotform also offers a 50-percent discount on annual paid plans for nonprofits and educators.
Analyze snapshots in time to generate an accurate report
Online forms can gather the data you need to analyze trends over time and make important business decisions.
Having too much information is better than not having enough of it, but breaking that data down, analyzing it, and creating a report can be a tedious task.
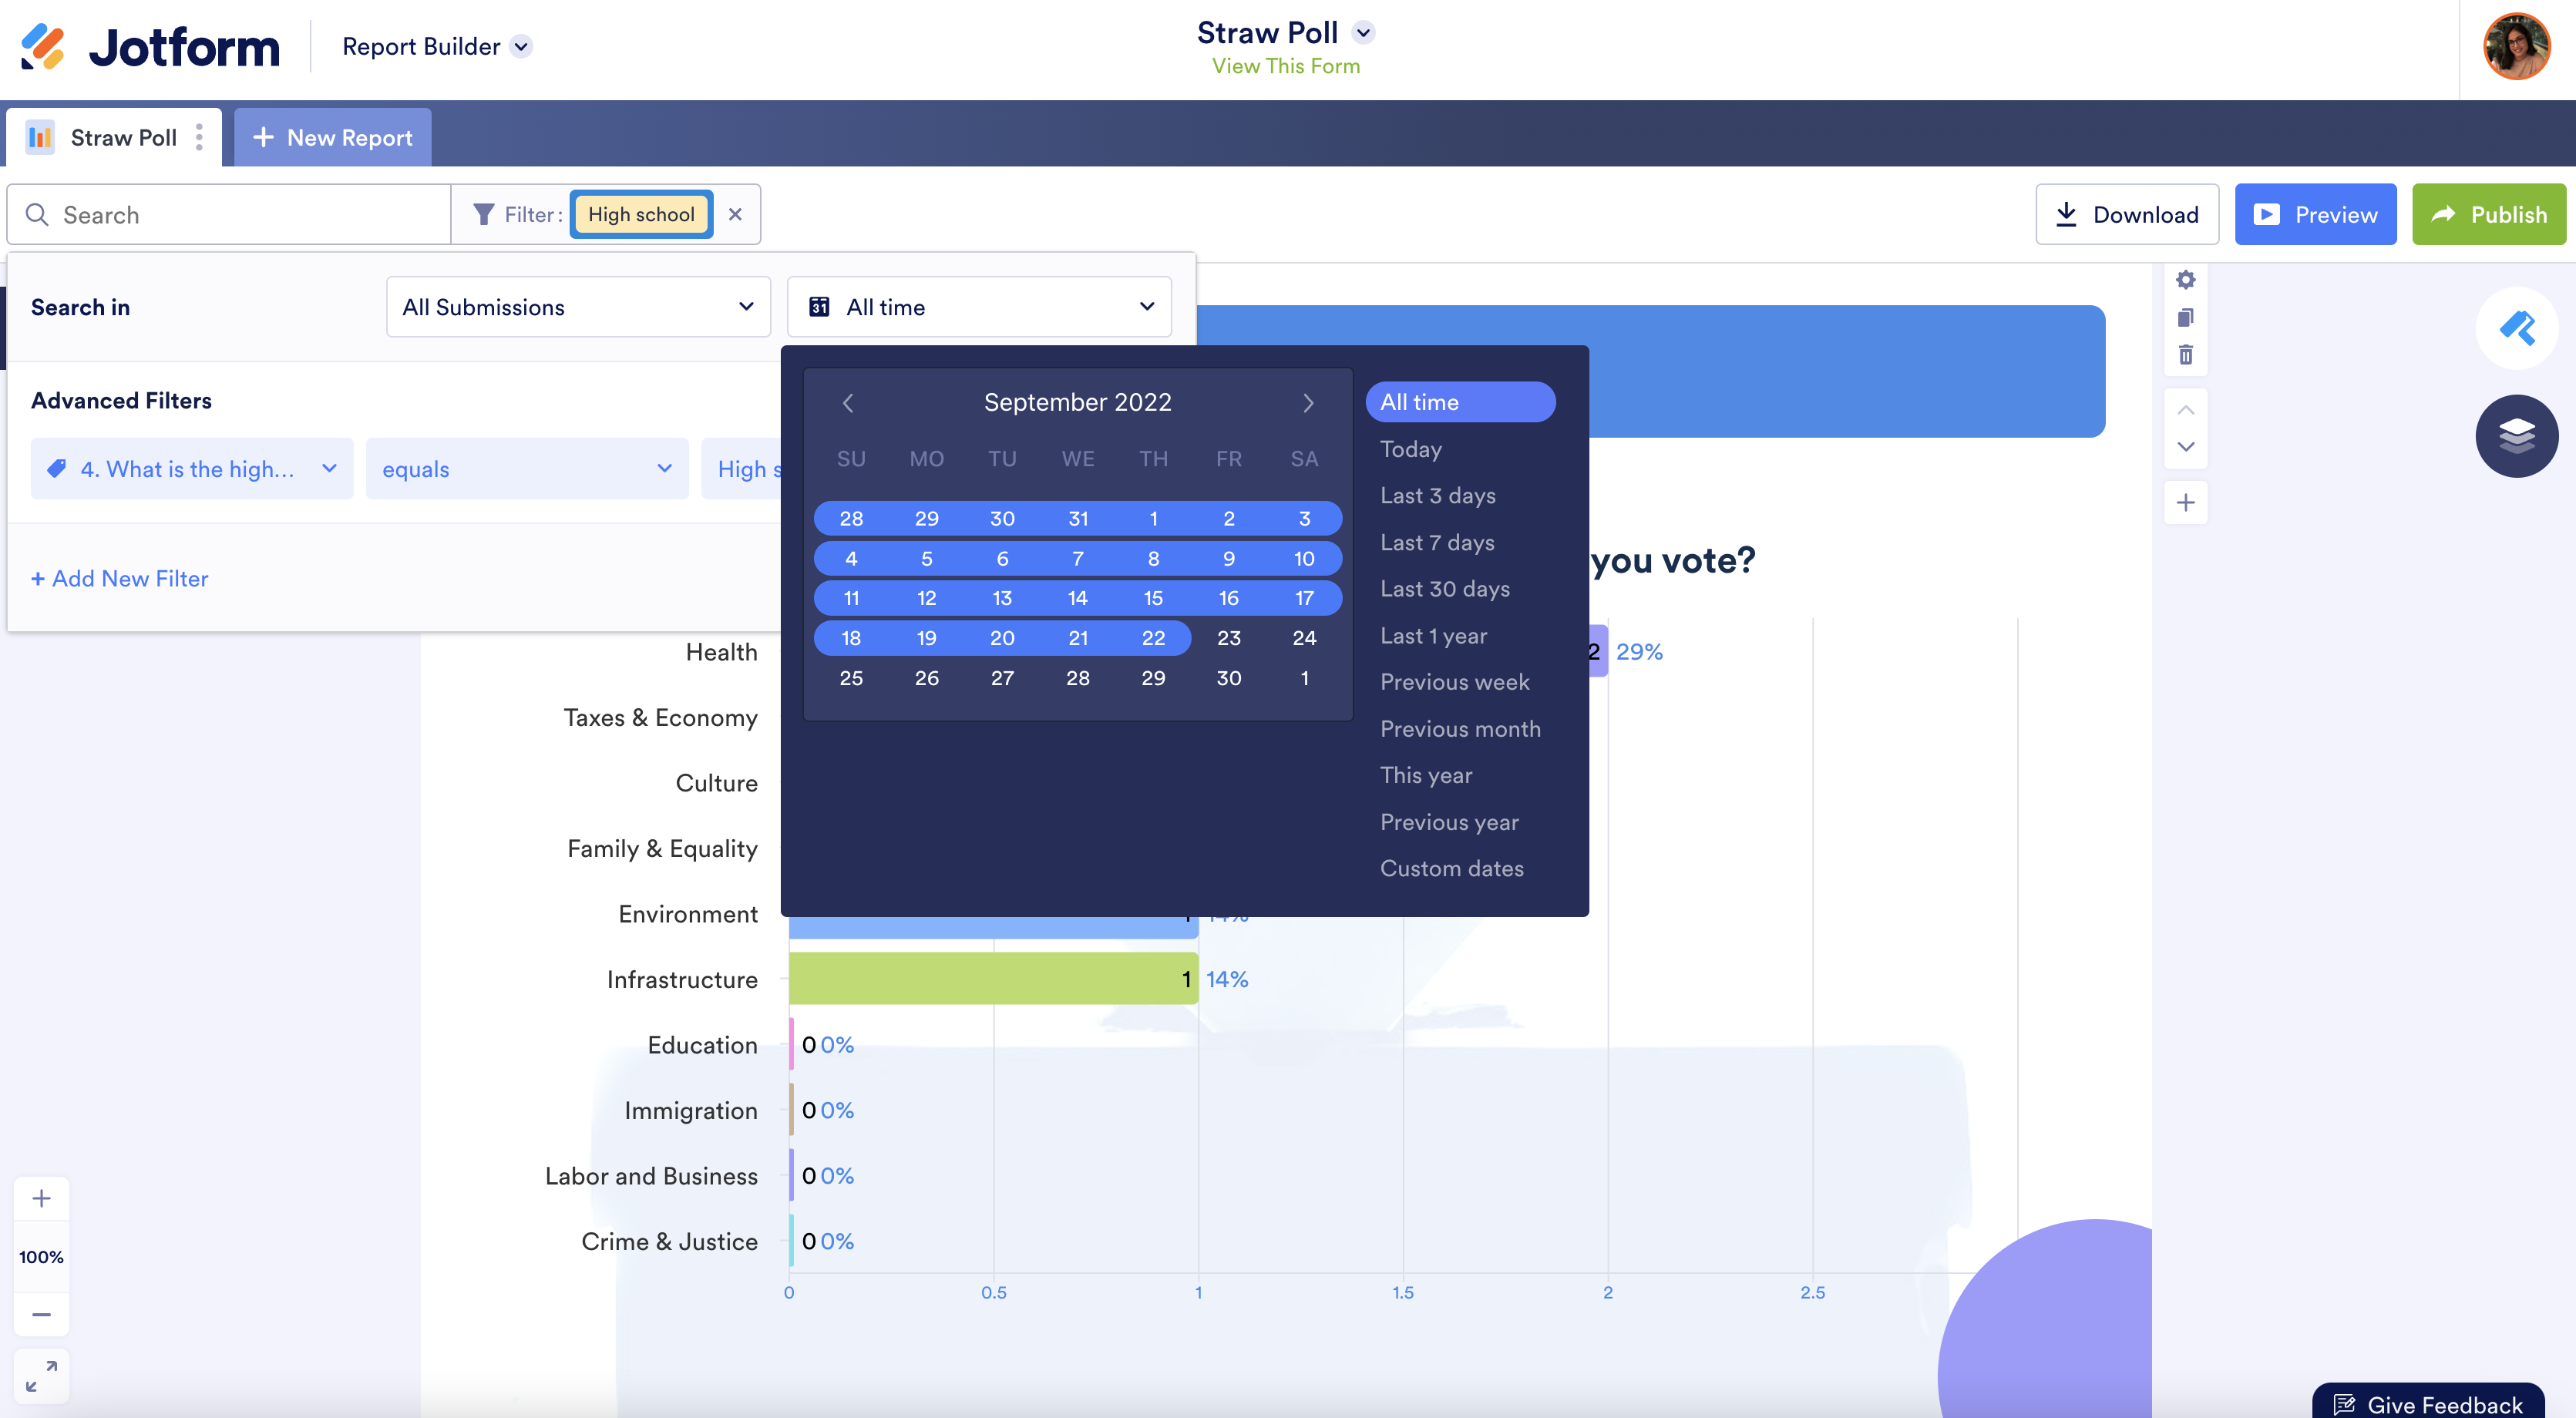
Jotform Report Builder can simplify this process by applying filters to your collected data and displaying only the relevant information you need on a report. Since these filters can be applied in seconds, creating a thorough and accurate report is a walk in the park.
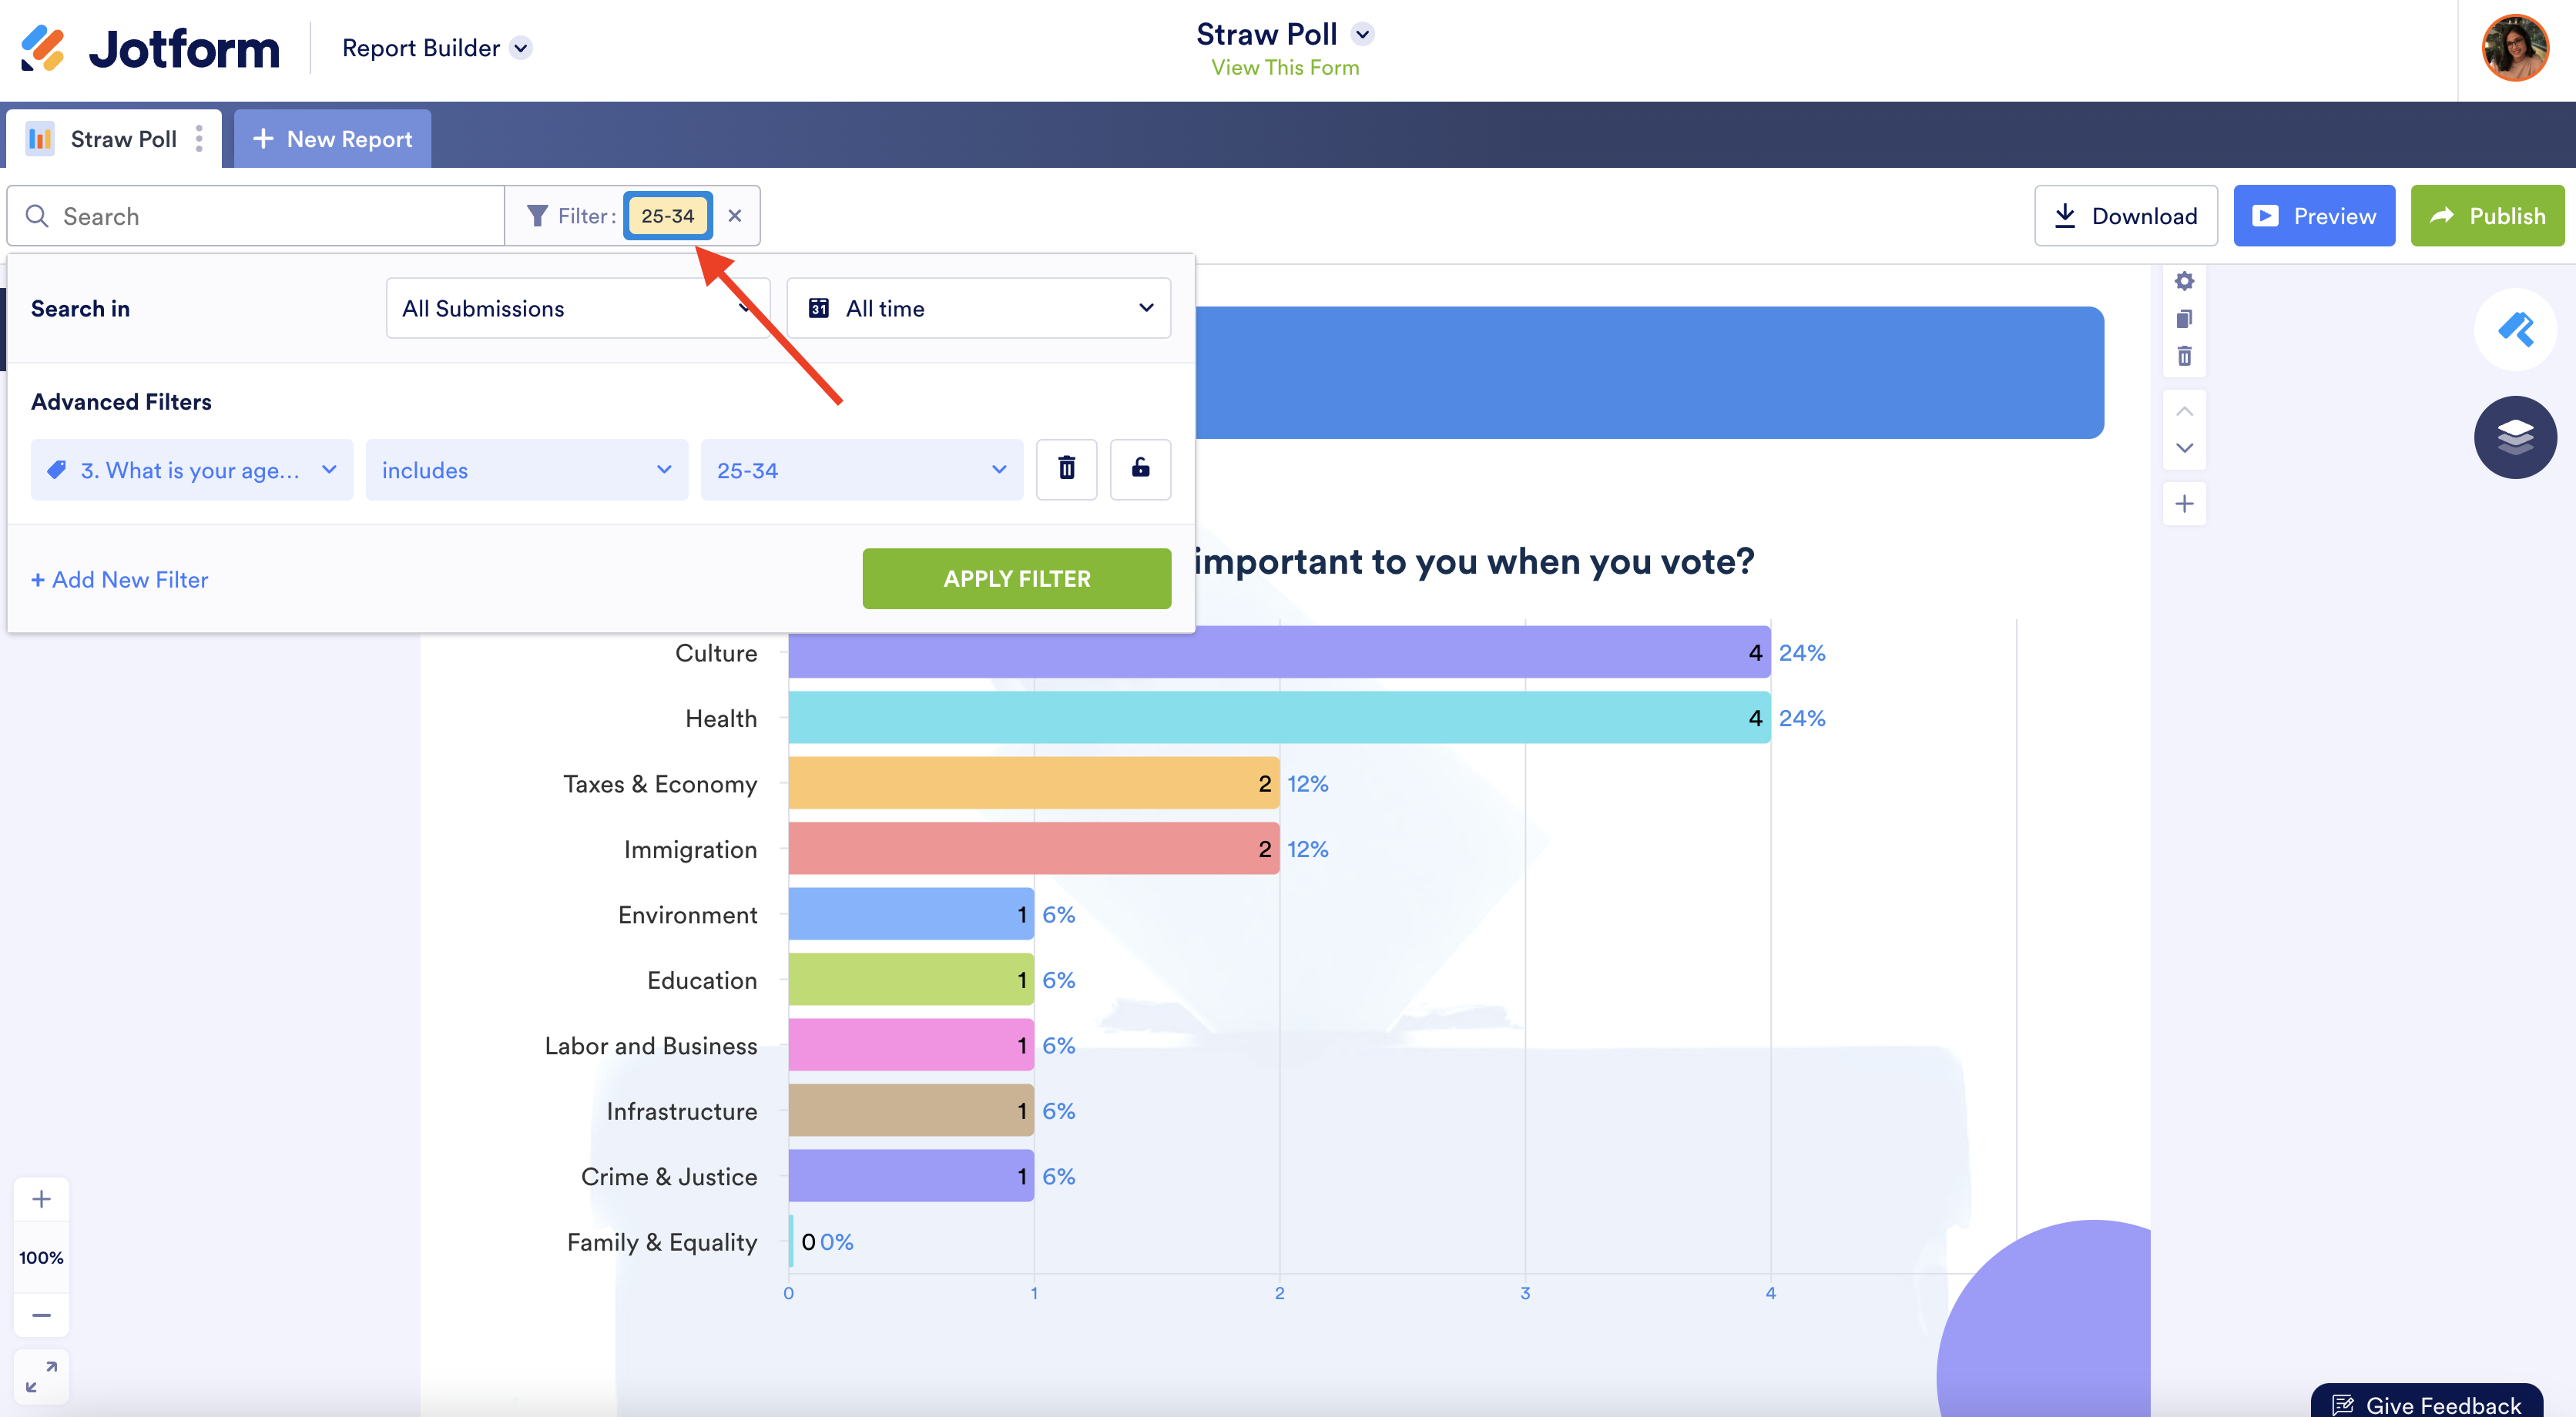
For instance, you can narrowly tailor your report’s analysis to show only online form responses that were submitted over the past week, month, or year.
If you need to provide a more detailed analysis, Jotform Report Builder can narrow down the information that’s displayed on a report by looking only at specific parameters, such as location, age ranges, company departments, or other listed answers to online form questions.
Seamlessly share your reports in a variety of formats
Creating reports used to take a lot of time and effort, and for good reason.
Even after you put together a detailed document that was easy on the eyes, you still had to get it in front of your team, as well as other key stakeholders, gatekeepers, or decision makers.
Jotform Report Builder makes this process a little easier by offering you a variety of report-sharing options that you can use without depending on any other software tools.
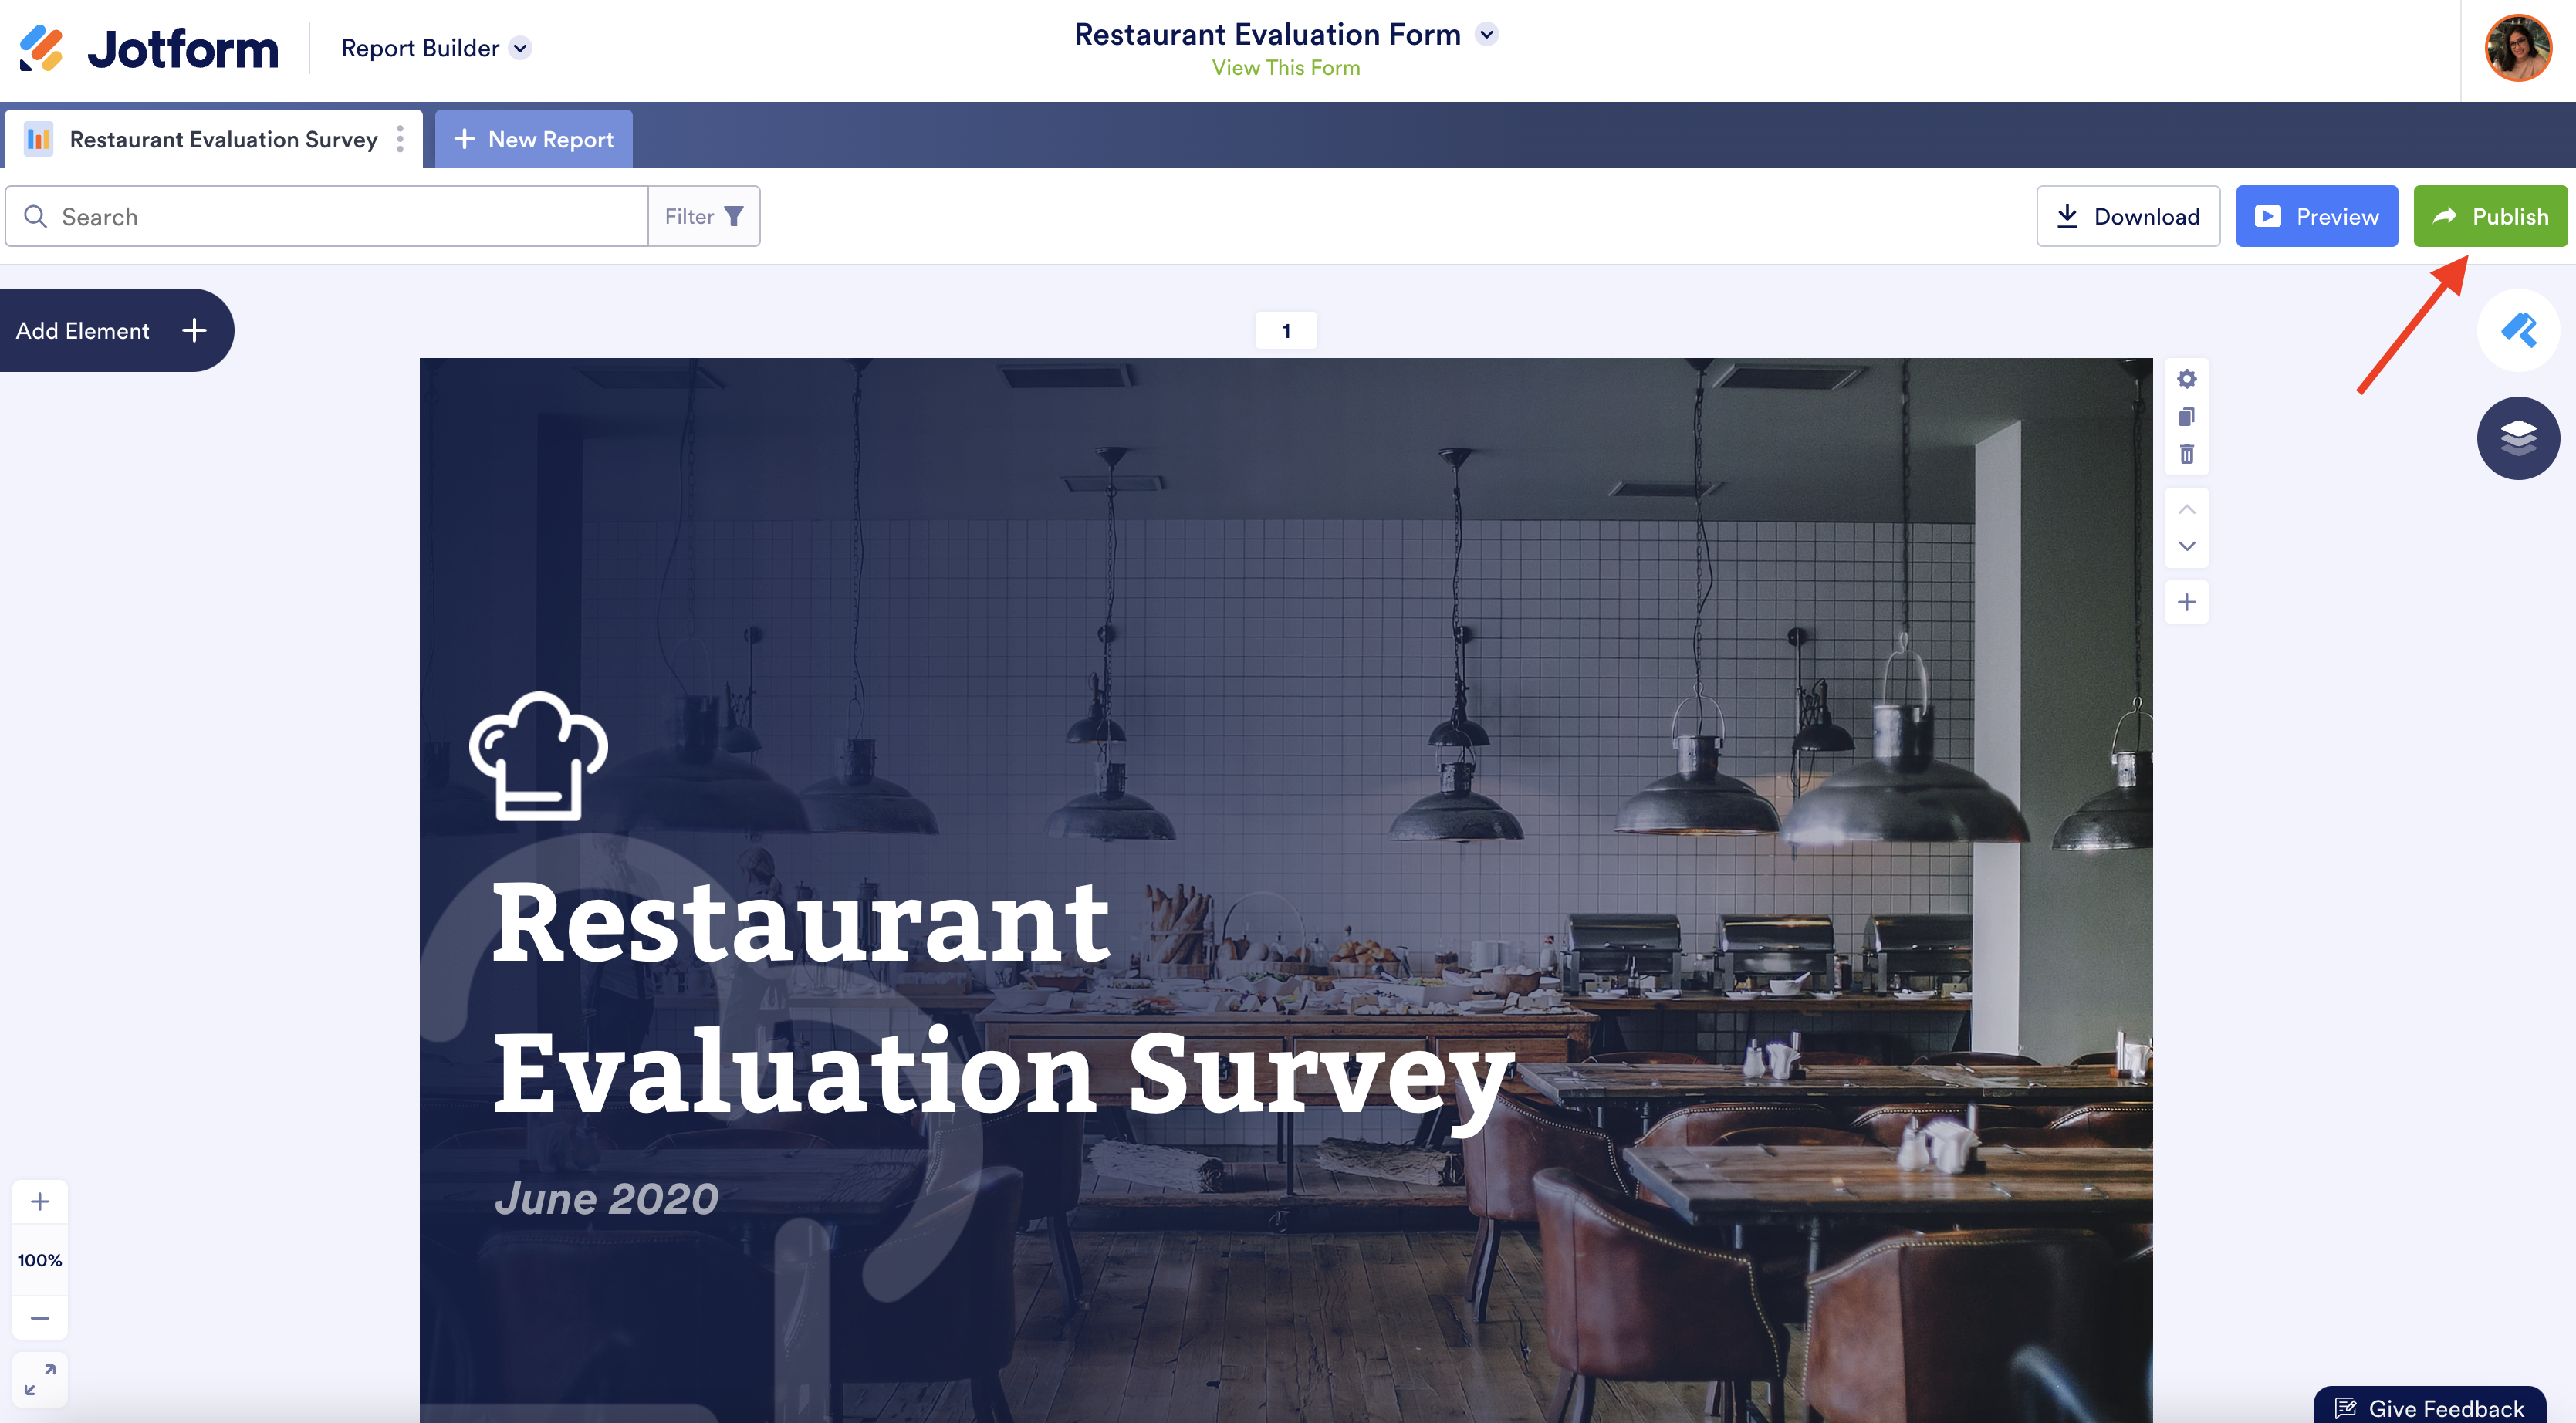
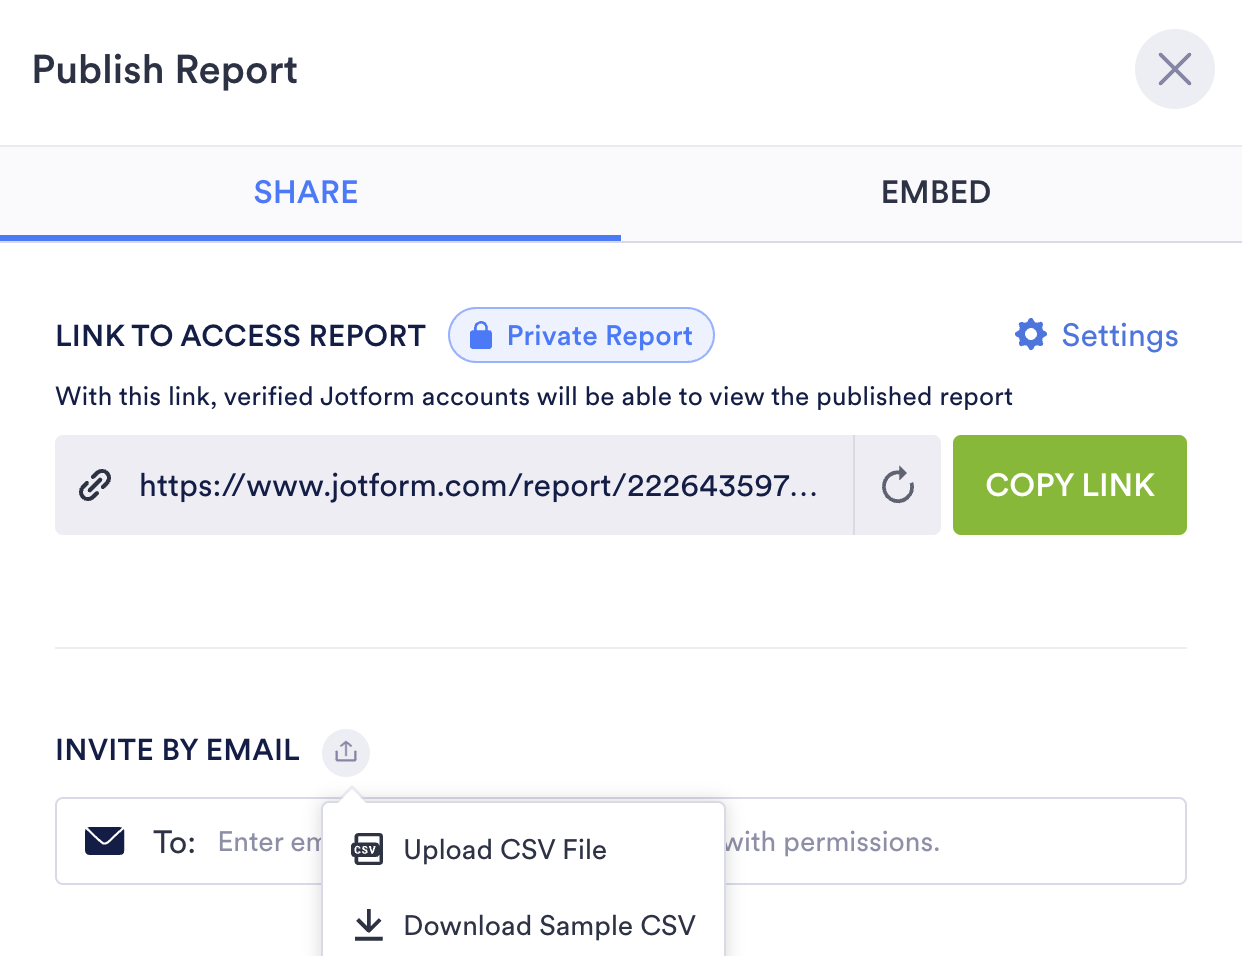
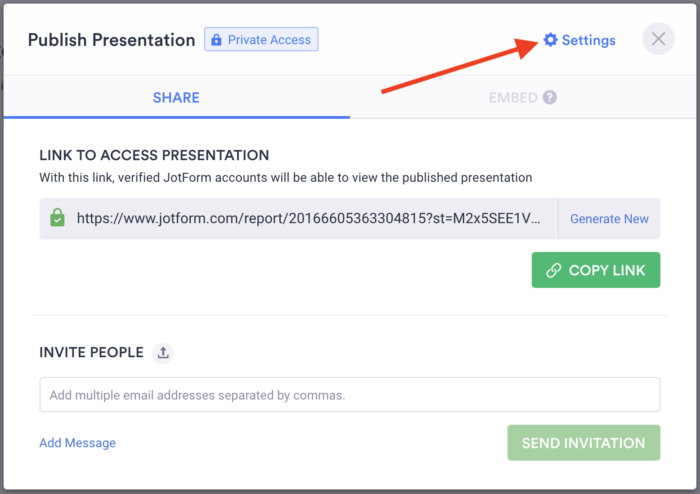
Jotform Report Builder — like the assign forms feature in the Form Builder — allows you to share your report through a dedicated link or a customizable email invitation.
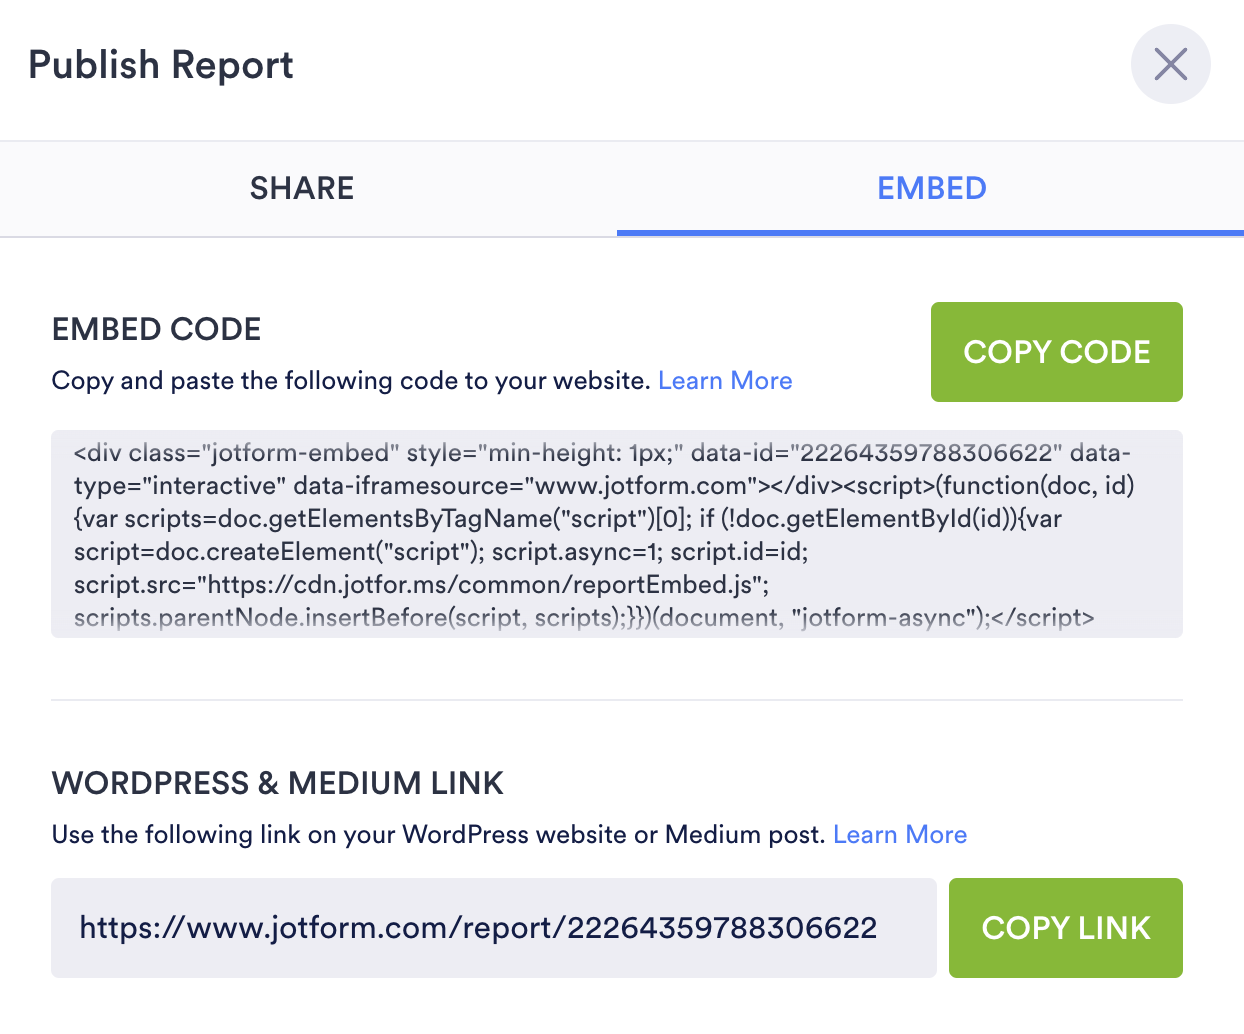
If you want to embed reports on your website or other content management platforms, such as WordPress and Medium, Jotform Report Builder can provide the relevant embed code or link, saving you time and effort.
Restrict access to reports and what can be done with them
Offering multiple ways to share a report can be helpful, but what if you need to limit who can view it and what people can do with it?
These restrictions and privacy measures can be particularly important if you need to share proprietary or confidential information.
You don’t have to sacrifice security for convenience with Jotform Report Builder.
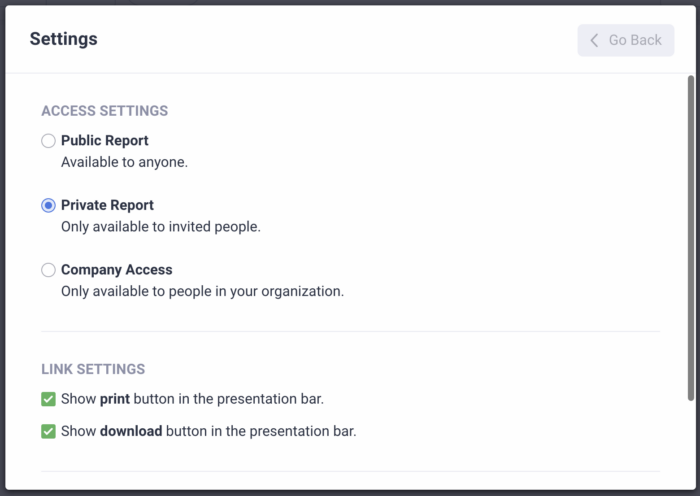
Aside from offering multiple ways to share a report, Jotform Report Builder lets you control who can access a report, what they can do with it, and how long it will be available to them.
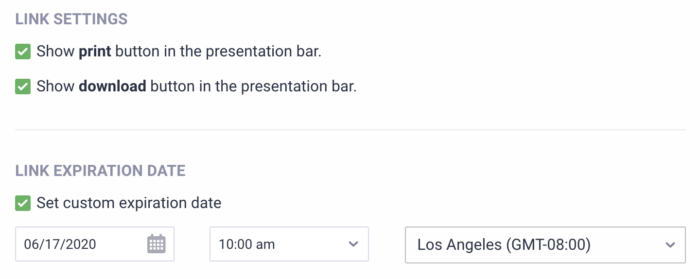
After specifying whether a report should be private, public, or available only to people with the same email domain name, indicate whether your document can be downloaded and printed.
If you want only specific people to access your private report, Jotform Report Builder can ensure that the shareable dedicated link to the report expires at a specific date and time. The link expiration feature, however, isn’t available for public reports or those that can only be accessed by people with the same email domain name.
Conclusion
Good business decisions are informed by facts, figures, and projections — not assumptions, guesses, or conjecture.
Jotform provides the tools you need to build online forms with offline capabilities and generate informative yet distinctive reports with your collected data.
Whether you’re conducting research, gauging the success of a program, or analyzing customer feedback to make improvements, Jotform Report Builder can automatically generate a beautiful report and provide the tools you need to seamlessly build one from scratch.
The choice is yours.
You not only have free rein over how your report is shared, but you can also protect it from prying eyes. With Jotform Report Builder, you can limit who has access to the document, what they can do with it, and how long it’s available to them.
If you haven’t done so yet, give Jotform Report Builder a try today and see how easy it is to create professional, data-rich reports that drive your point home.





Invia un Commento:
5 Commenti:
Più di un anno fa
Do you support calendar format reports?
Più di un anno fa
Is there any limit for data analysis?
Più di un anno fa
Is there a way to show a chart of just a single individual's entry? For example, 50 numeric fields calculated to 10 totals with a bar chart showing the 10 totals. Thanks.
Più di un anno fa
super impressed! Time saving and impressive looking Makes creating the report as fun as sharing the report and can be applied to so many different categories.
Più di un anno fa
Is the way to download appointment list sorted by date and time?