Overview
The Admin Console gives you detailed insights into your workflows. As an admin, you can track all workflows to monitor usage across your organization.
Workflow Analytics
Data in the Analytics tab updates every 5 minutes.
Workflow Metrics:
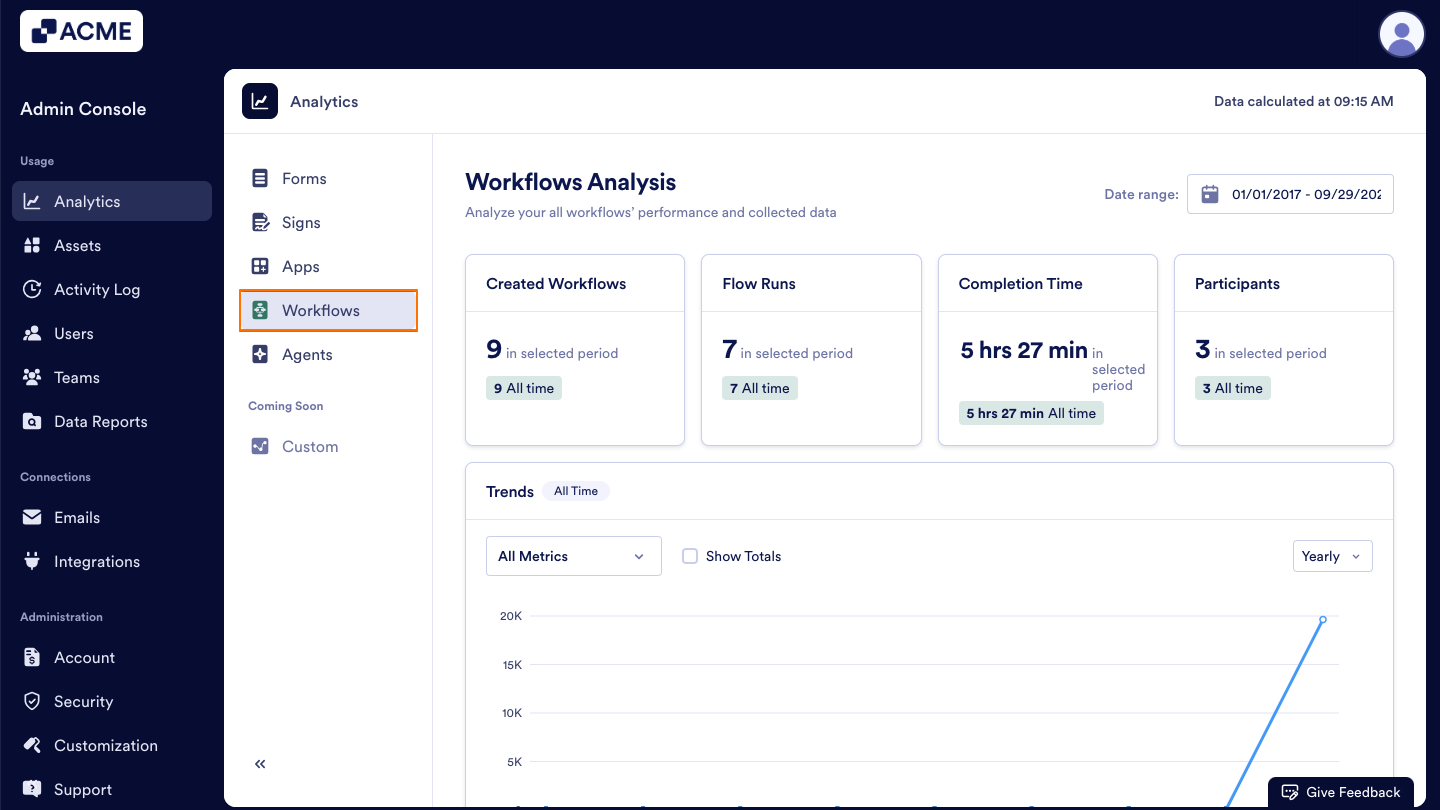
- Created Workflows: The total number of workflows that have been created within the selected date range.
- Flow Runs: The number of times a workflow is triggered—counted each time the first form is submitted by a form filler within the selected date range.
- Completion Time: The average time it takes for all workflows to be completed from start to finish within the selected date range.
- Participants: Participants are the individuals actively involved in each flow, including signers, approvers, task assignees, and others who interact with its steps within the selected date range.
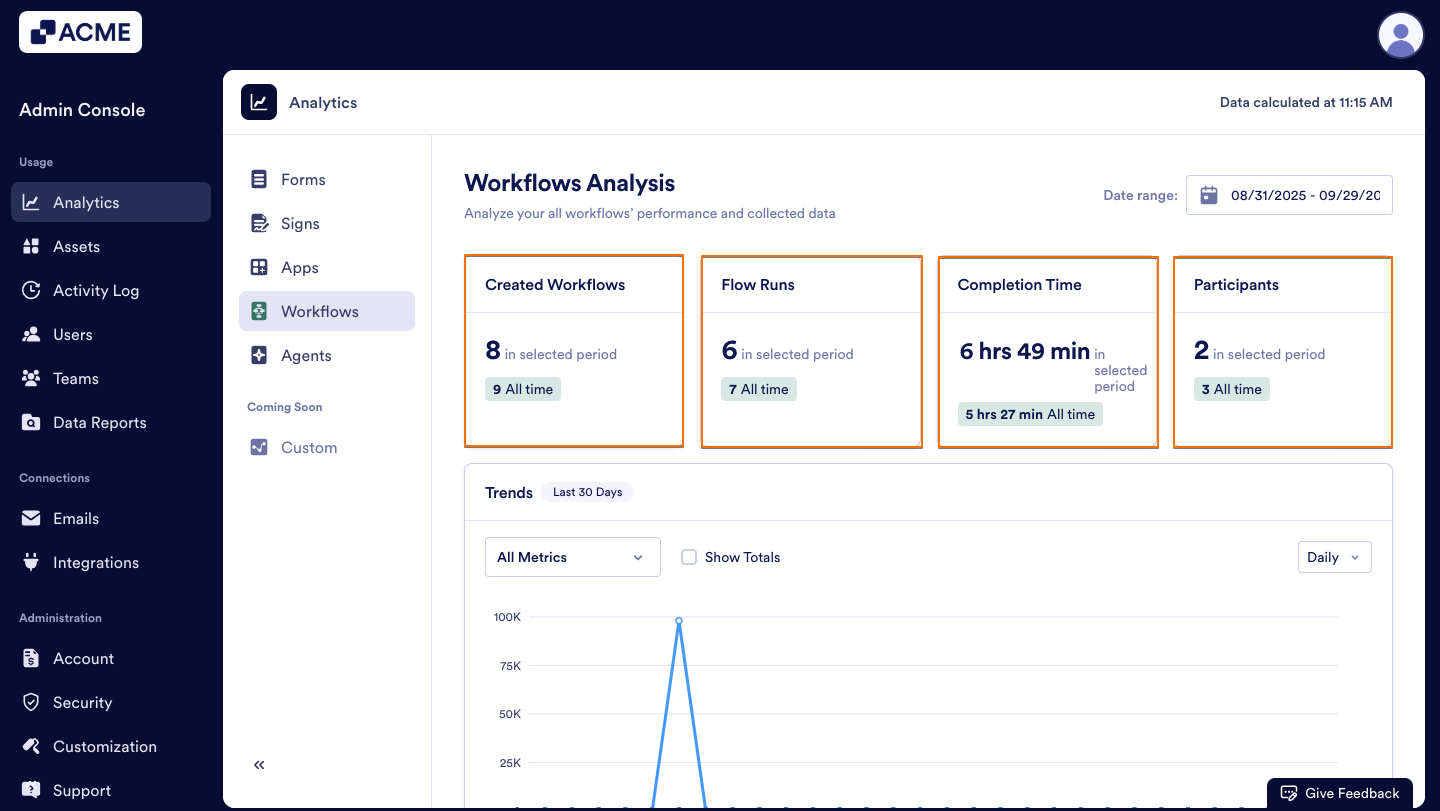
Let’s walk through how to reach the Workflow metrics:
- In the Admin Console, click on Analytics on the left-hand side of the page.
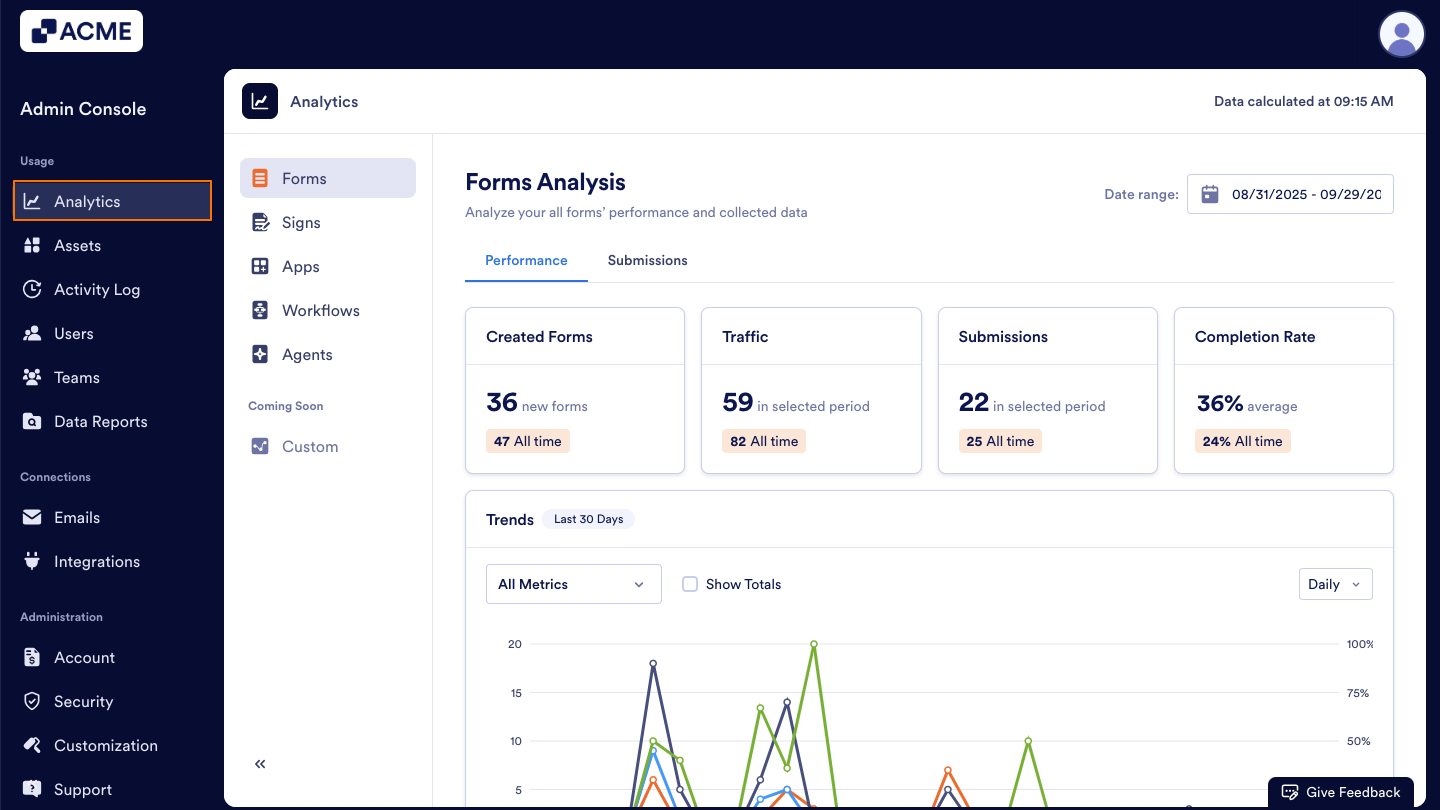
- Next, click on Workflows to open Workflow Analysis data

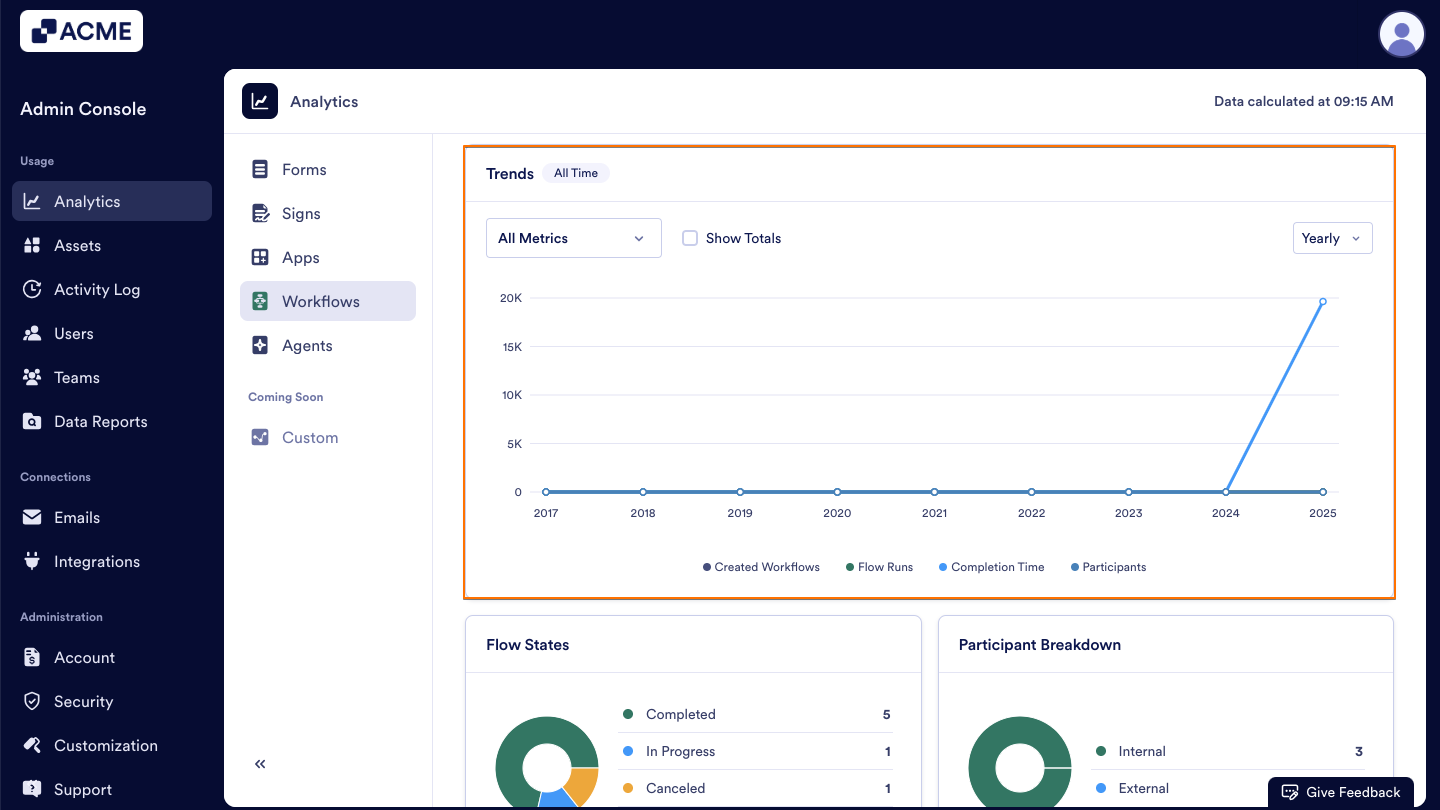
Trends Chart
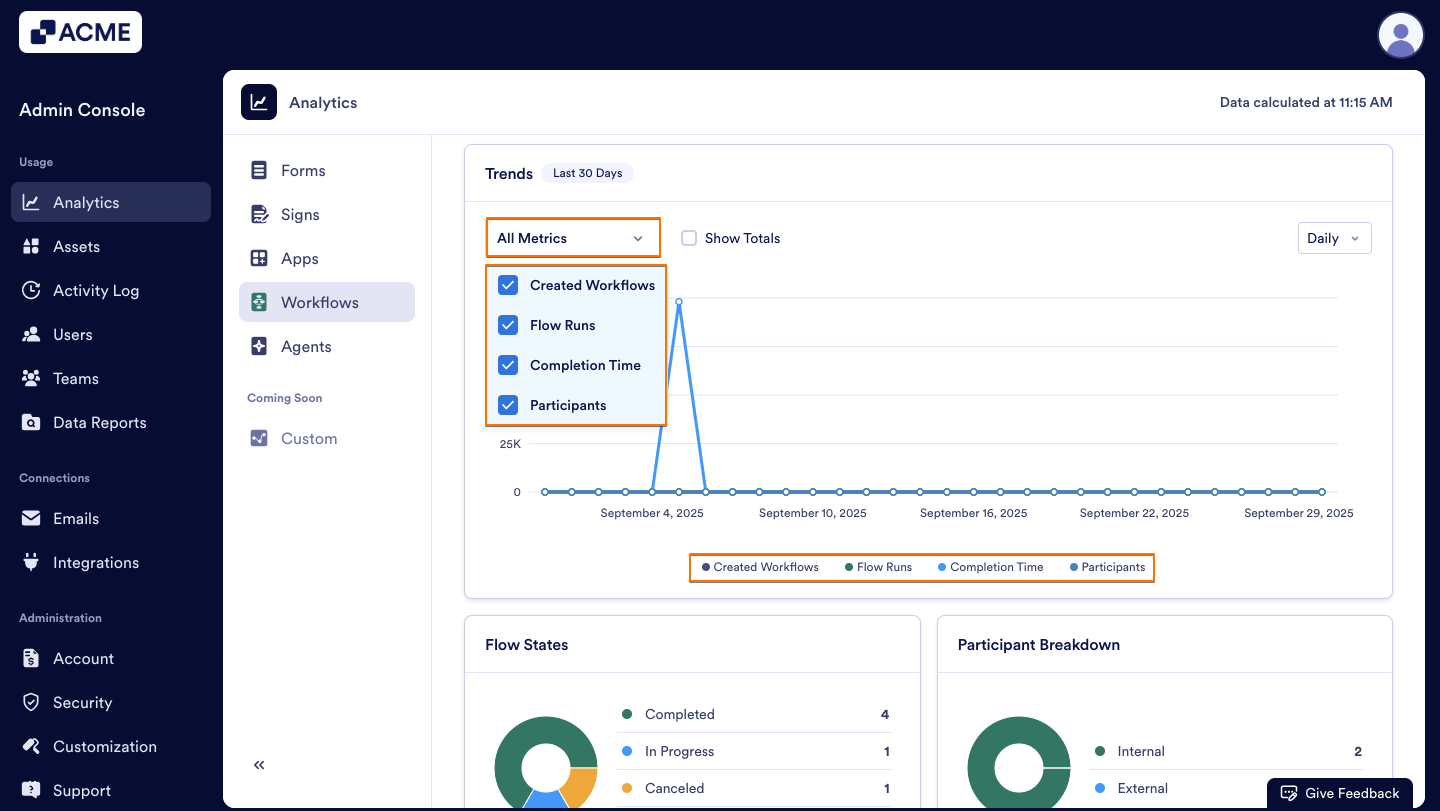
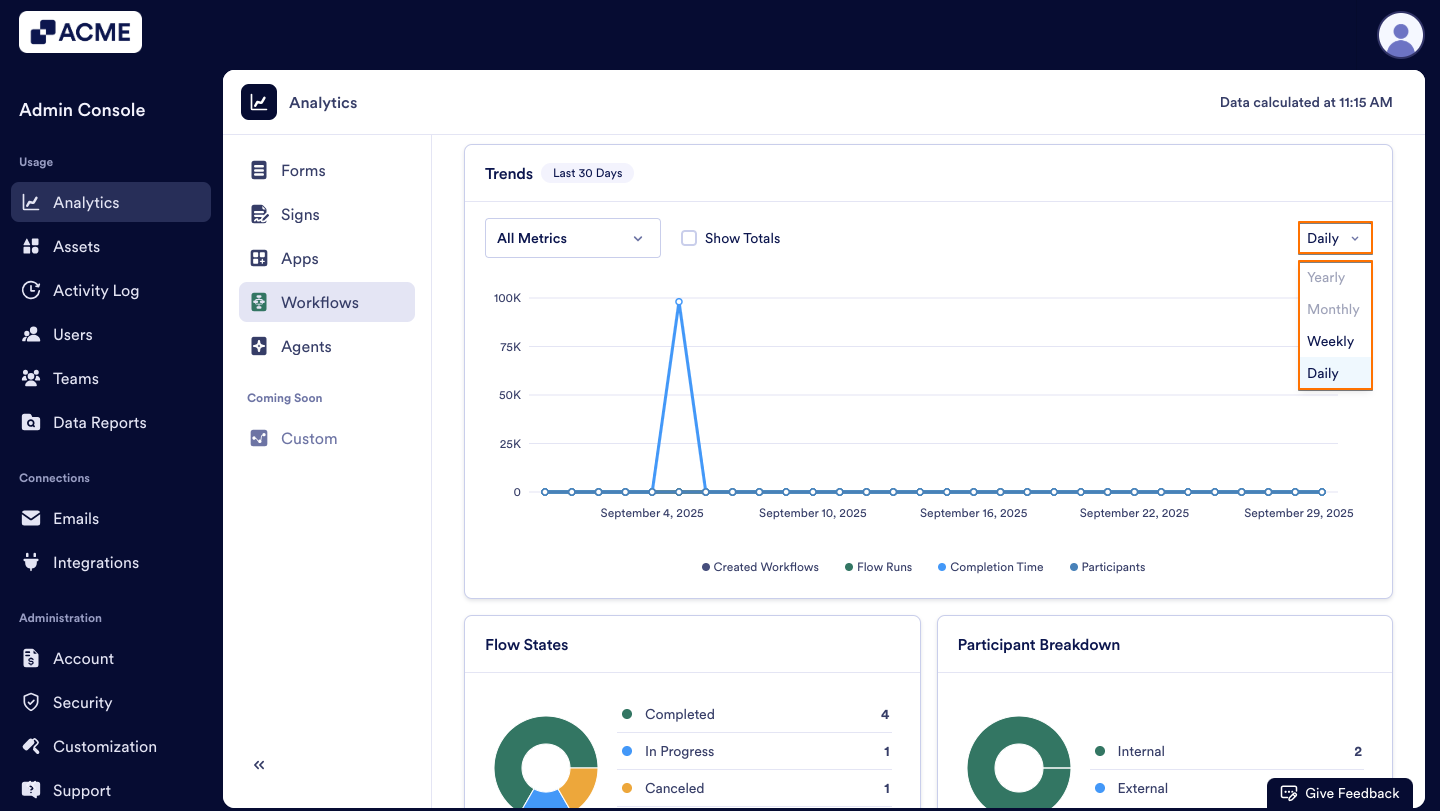
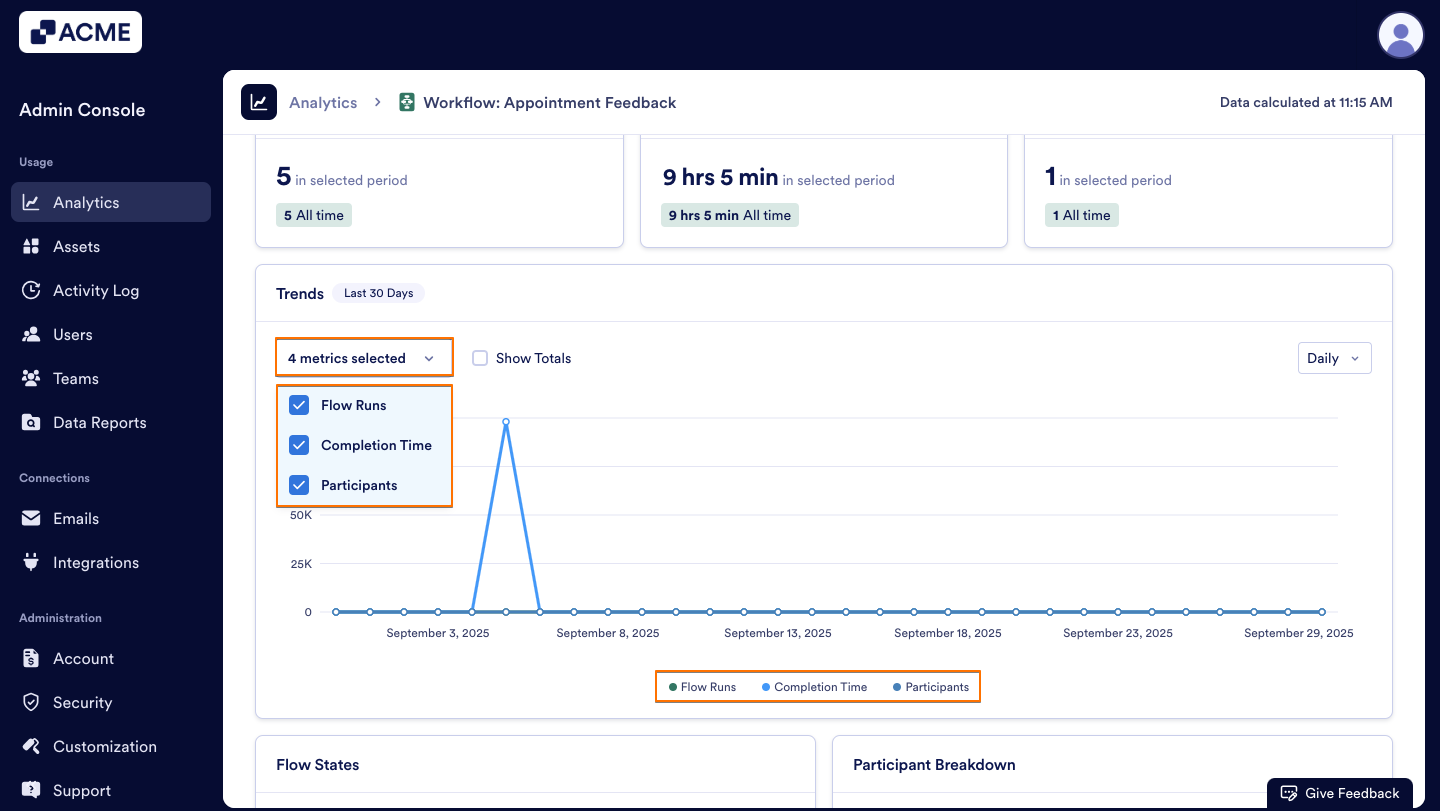
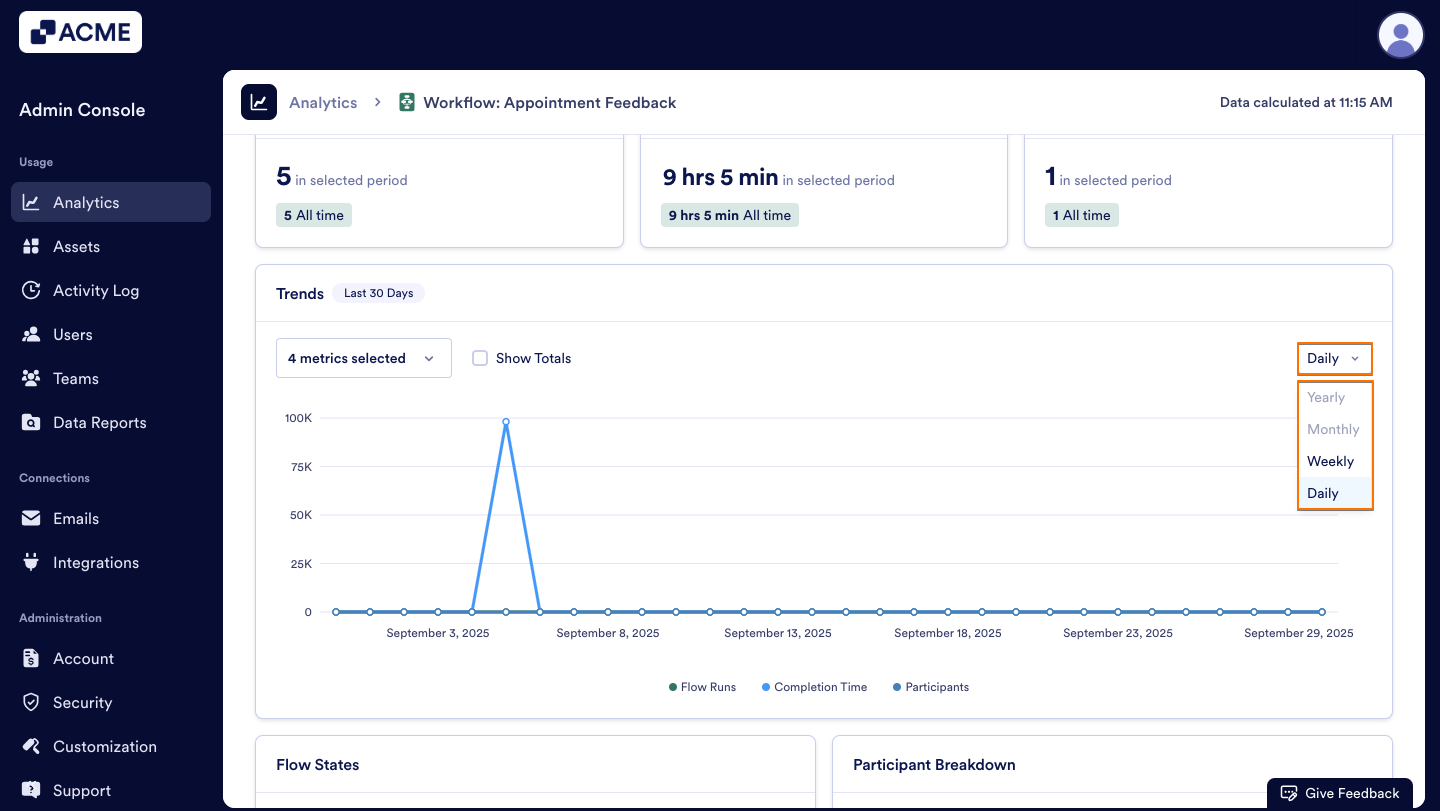
Under the Workflow section, a Trends Chart is available. This line chart visualizes the metrics above and helps you track your organization’s workflow performance across a selected date range. You can also decide which metrics to include or exclude and adjust the chart view by daily, weekly, monthly, or yearly intervals.
Let’s walk through how to reach the Trends chart:
- In Workflow Analytics, first select the desired date range.
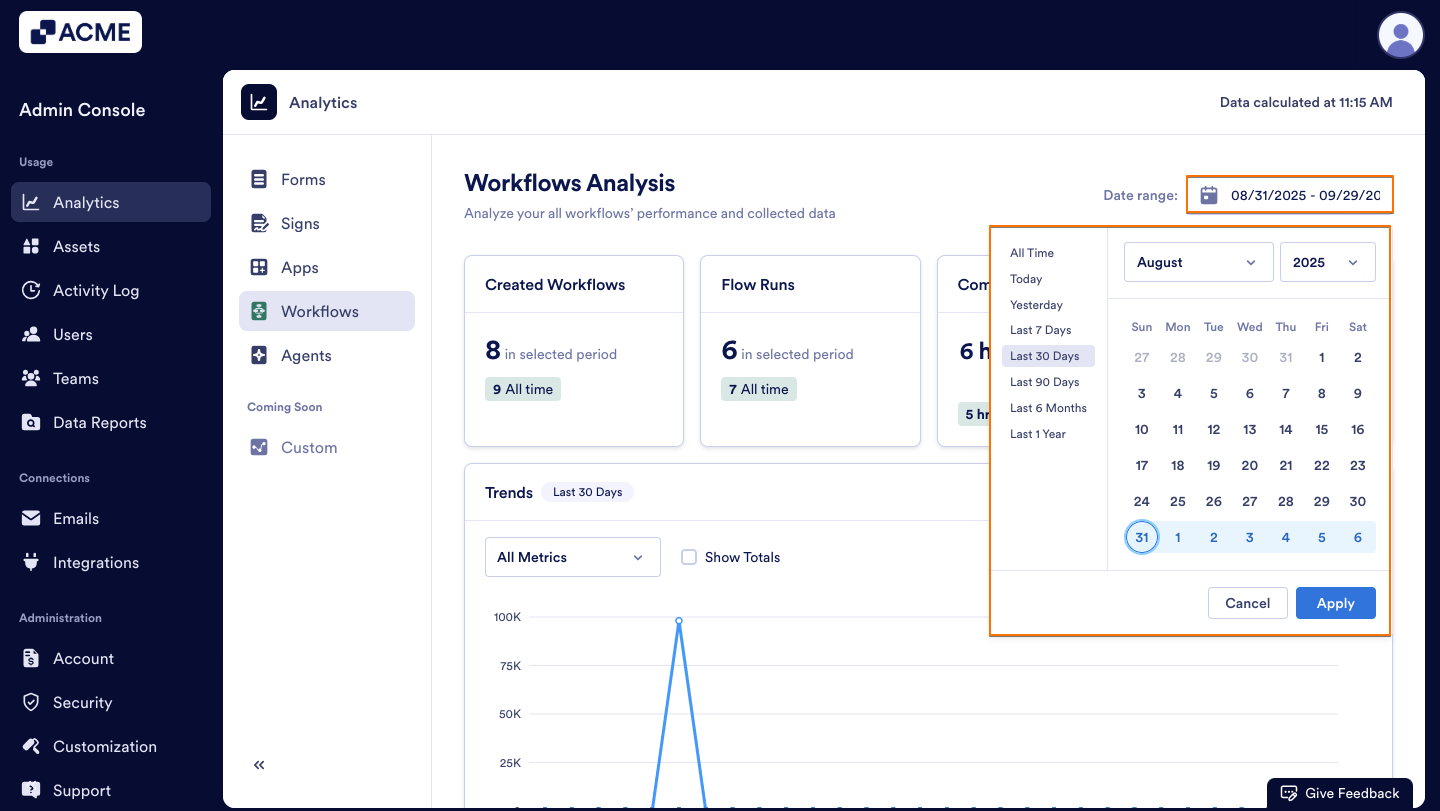
- Next, from the dropdown, choose the metrics to include (created workflows, flow runs, completion time, participants). You can also select them by clicking on the indicators below the graph.
- Finally, set the view to daily, weekly, monthly, or yearly.
Flow States
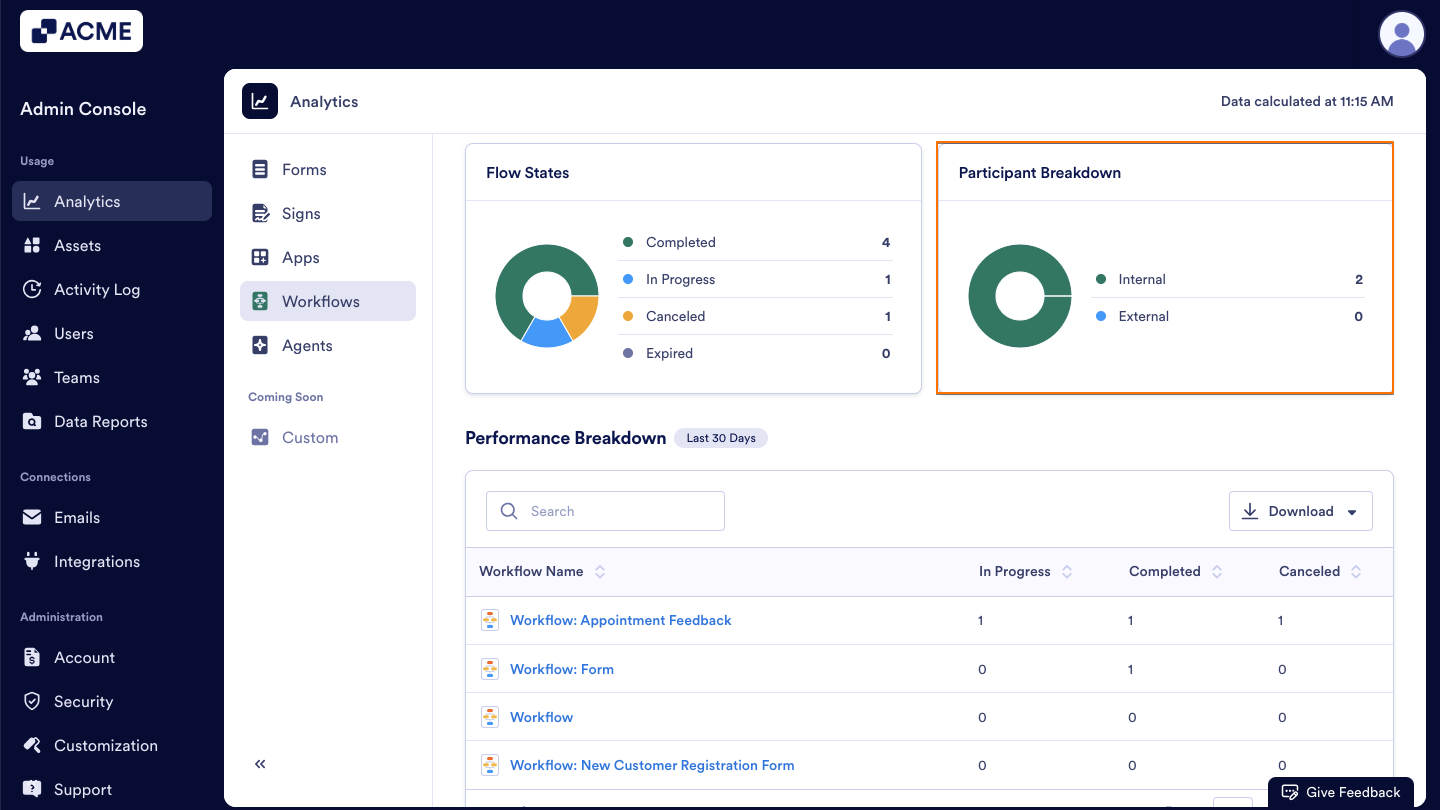
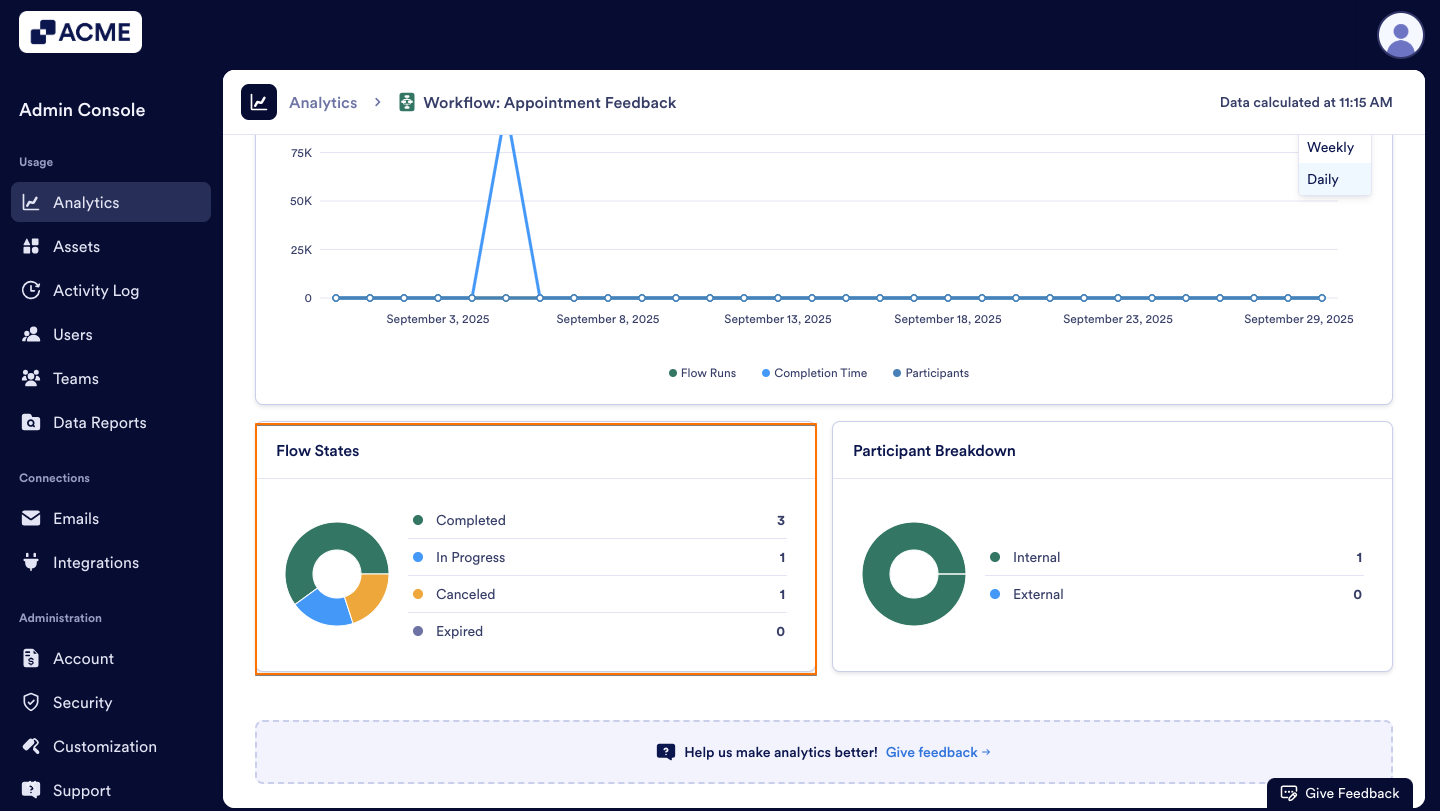
Right after the line chart, the Flow States card is displayed. This pie chart shows the counts of all flows statuses within the selected date range:
- Completed: The total number of flows that have successfully finished all steps within the selected date range.
- In Progress: The total number of flows that are currently running and have not yet completed all steps.
- Canceled: The total number of flows that were manually or automatically stopped before completion.
- Expired: The total number of flows that were not completed within the allowed time and are no longer active.

Participant Breakdown
Right next to the Flow States card, you will see the Participants Breakdown pie chart. This chart displays the distribution of participants across the workflows as:
- Internal: Participants who belong to the organization (e.g., employees or team members).
- External: Participants outside of the organization (e.g., form filler, customers).
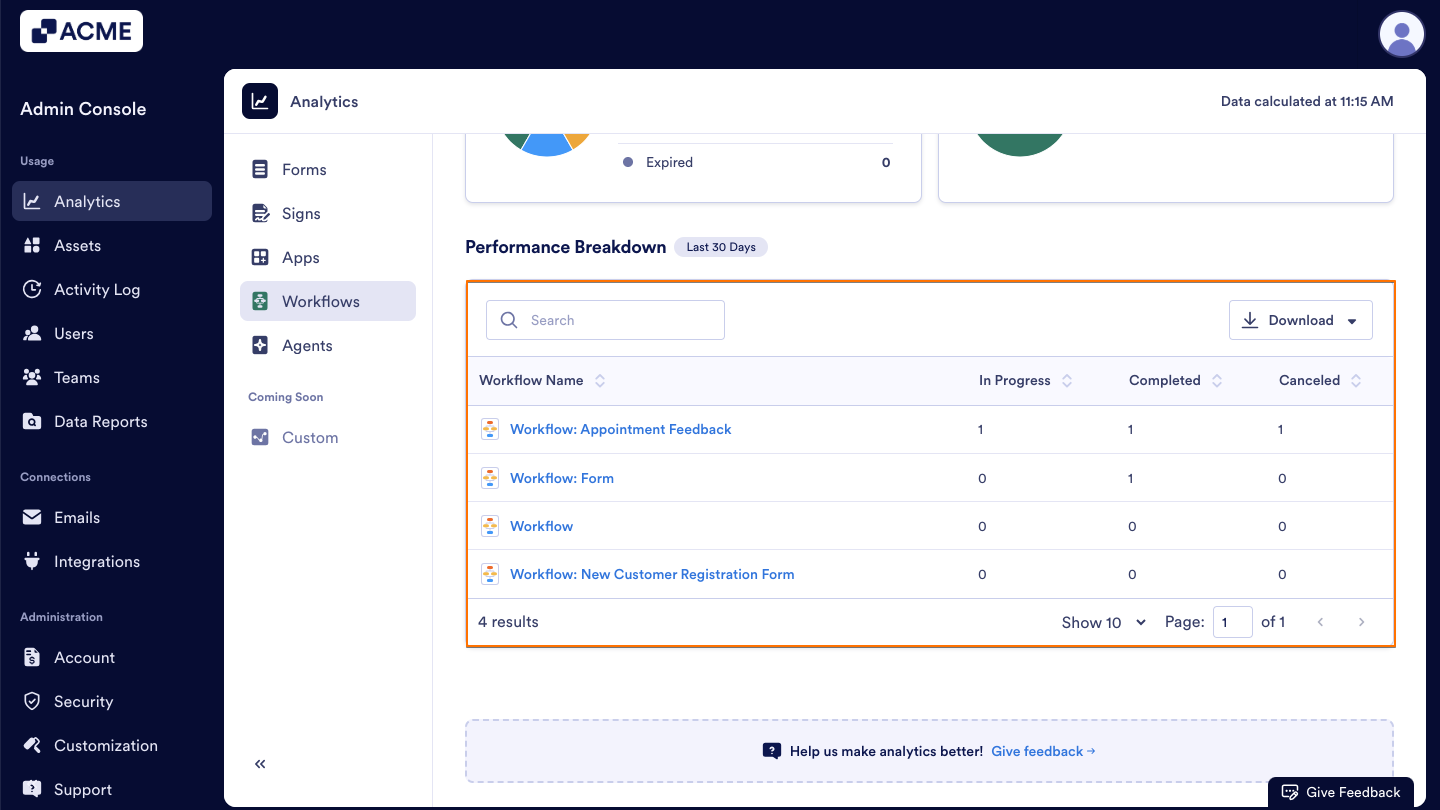
Performance Breakdown
In this section, you will see the distribution of all workflows created across the organization based on the selected date range. The list shows each workflow’s name, the number of In Progress, Completed, and Canceled documents, the average completion time during the selected period, and the workflow owner.
Tip: When the date range is selected at the top of the page, the selection will be applied to all metrics.
Let’s walk through the steps together:
- In the Admin Console, select Workflows from the Analytics section.
- Scroll down to the Performance Breakdown list to see all workflows.

Download Workflow Data
In this section, you can also download Workflow data, that includes workflow name, completion status, average completion time, owner, etc.:
- In Workflow Analytics, scroll to Performance Breakdown.

- Click on Download and select how you’d like the file to be downloaded.

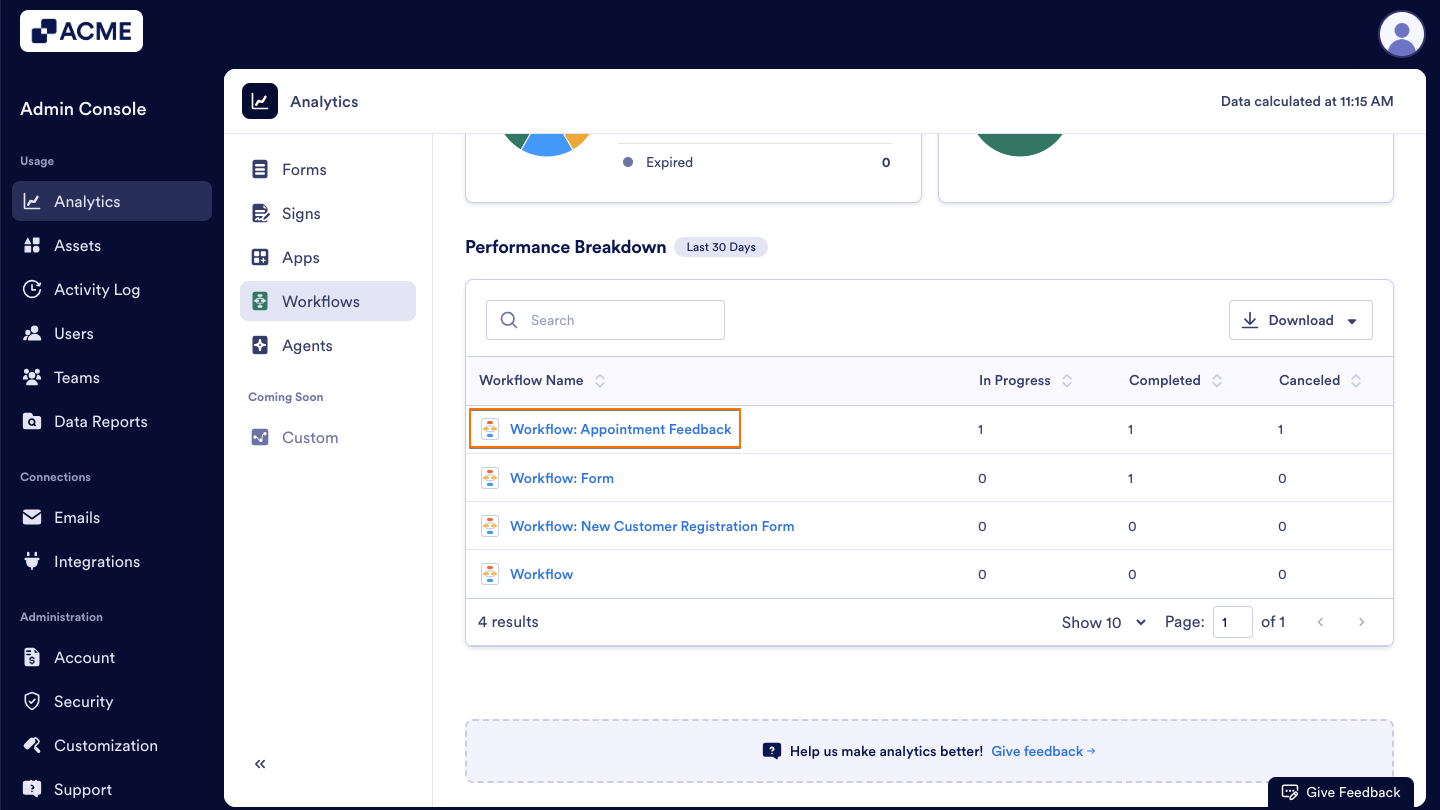
View Analytics for a Single Workflow
You can also view the data for a specific Workflow in the Analytics page. We’ll walk through together on steps:
- In the Admin Console, click on Analytics on the left-hand side of the page.

- Next, click on Workflows to open the Workflow data.

- Then, scroll to Performance Breakdown and locate the workflow you’d like to review.
- Finally, click on the Workflow name to open the analytics for the individual workflow.
On the dedicated page, you will see the following sections:
Workflow Metrics
- Flow Runs: The number of times this workflow is triggered—counted each time the first form is submitted by a form filler within the selected date range.
- Completion Time: The average time it takes for this workflow to be completed from start to finish within the selected date range.
- Participants: Participants are the individuals actively involved in this workflow, including signers, approvers, task assignees, and others who interact with its steps within the selected date range.
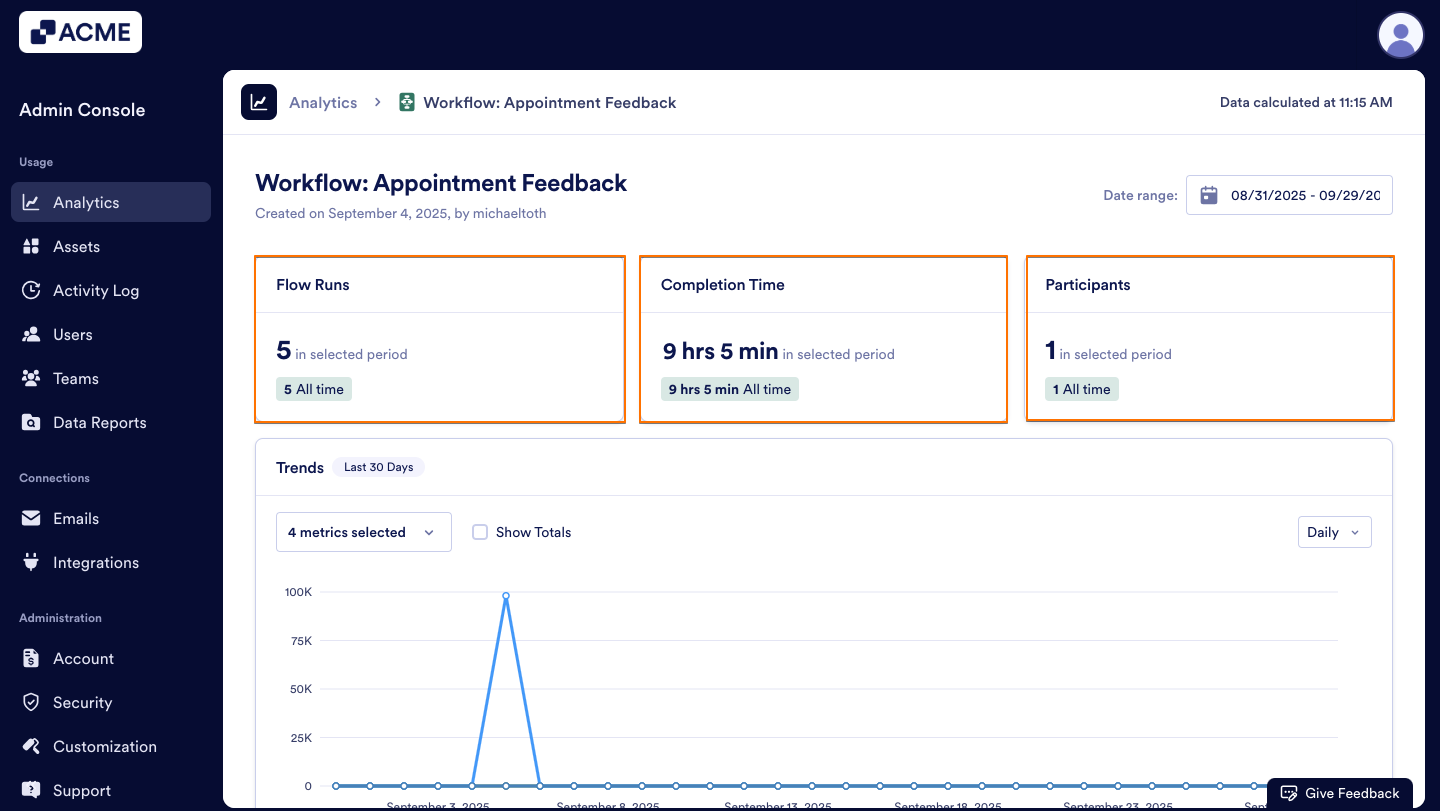
Trends Chart
Below the metrics, you will see the trend chart specific to this workflow. This chart visualizes how the workflow’s runs, completion time, and participants have changed over the selected date range. Just like in the main Workflow Analytics view, you can decide which metrics to include or exclude and adjust the chart view by daily, weekly, monthly, or yearly intervals.
Let’s walk through how to use the trend chart on a single workflow page:
- First, select the desired date range at the top of the page.
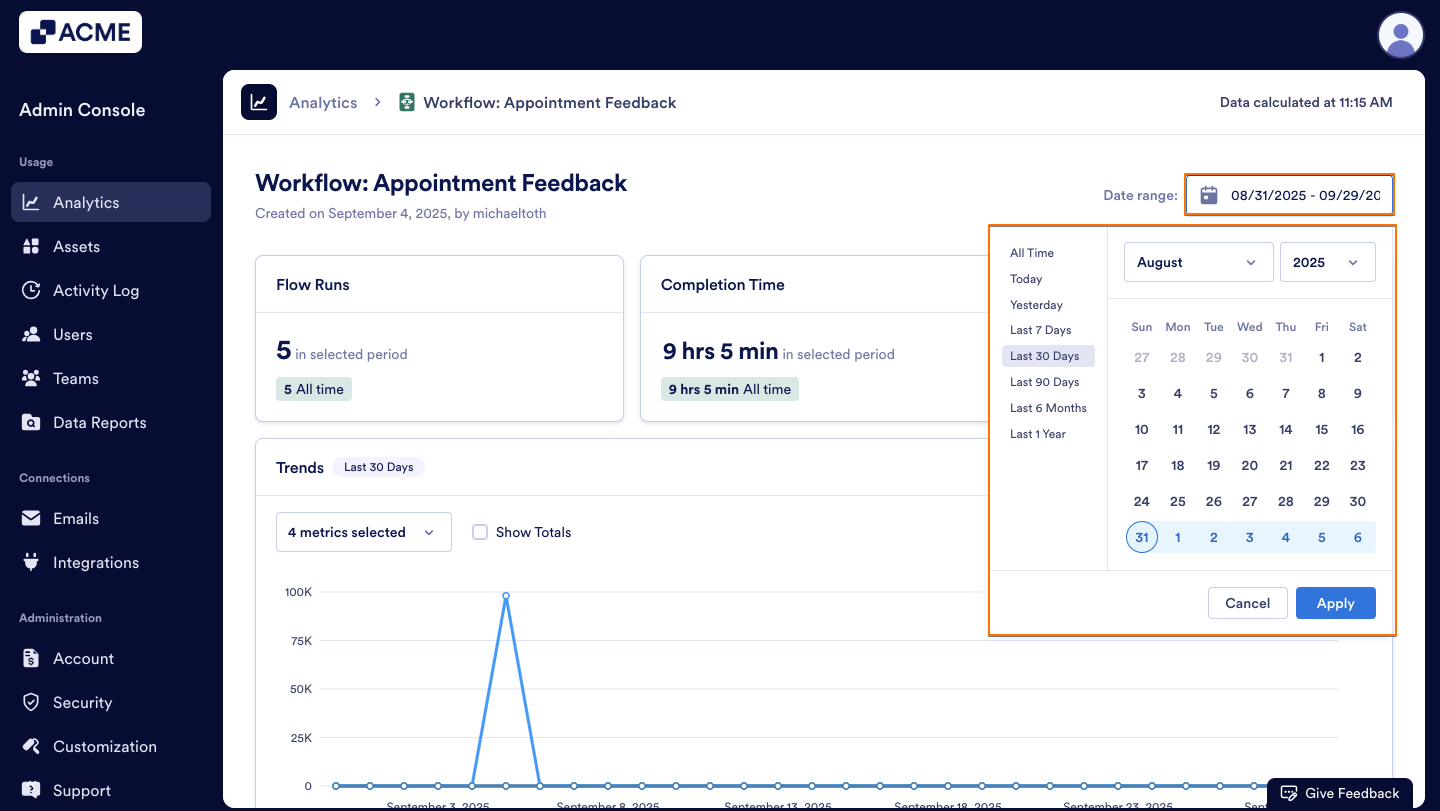
- Next, open the metrics dropdown to choose which data points to visualize. You can also click on the indicators below to select the data points.
- Finally, set the chart view to daily, weekly, monthly, or yearly.
Flow States
A pie chart summarizing the workflow’s statuses:
- Completed: The total number of flows that have successfully finished all steps within the selected date range.
- In Progress: The total number of flows that are currently running and have not yet completed all steps.
- Canceled: The total number of flows that were manually or automatically stopped before completion.
- Expired: The total number of flows that were not completed within the allowed time and are no longer active.
Participant Breakdown
A donut chart showing the ratio of participants:
- Internal: Participants who belong to the organization (e.g., employees or team members).
- External: Participants outside of the organization (e.g., form filler, customers).


Send Comment: