
Best reporting tools
Data reporting tools are yet another technological advancement developed to make the lives of business professionals easier. With the power of software tools like these, businesses can get detailed reports on their performance without going through the time-consuming process of creating each report manually.
There are a lot of options for advanced reporting tools and software on the market today. Finding the right ones for your needs may take some time, but here’s a look at some of the top tools available for businesses today to help get you started.
What are reporting tools?
A reporting tool is any type of software, widget, or plug-in that takes data from one or more sources and converts it into a readable report. These reports come in all kinds of formats, including charts, graphs, tables, slide presentations, and any other visual you might expect to see during a typical business meeting.
The software is designed to take disparate data points and convert them into actionable information without a whole lot of human effort. If it’s your job to leverage reporting tools and software for your company, you’ll want your selection to come with a user interface that’s both robust and easy to understand.
At the same time, reporting tools need to be powerful enough to get to the bottom of a complex issue without obscuring or missing valuable data points. With the right tools, you can use data for your business in new and more meaningful ways.
Why do businesses use reporting tools?
The faster and more accurately you can present data to stakeholders, the more insights they’ll have at their disposal to make the right decisions. These tools give businesses the ability to make sense of scattered or confusing data. If you’ve ever felt like you had access to the right information but no way of making sense of it, reporting tools are for you.
The top 5 reporting tools
Knowing you have a need for reporting software is half the battle. Your next step is to choose the right service or software to get it done for you. Here are some of the best available reporting software tools on the market today.
1. Jotform
Using online form builder Jotform as a reporting software service makes a lot of sense. After all, Jotform offers more than 800 premade report templates already set up to collect and process data. And with Jotform Tables, you can work from 300-plus table templates to store that data as well.
Jotform’s Report Builder feature can then help you visualize that data and flesh out a presentation to share with your stakeholders. Once you’ve created a report, Jotform easily integrates with a number of other platforms so you can share it however and with whomever you like.
2. Wrike
Wrike is a highly regarded tool in the field of project management, but it’s also useful for data reporting. Thanks to its ability to keep track of productivity metrics, it’s a great reporting tool for anyone looking to take a deep dive into their business’s performance. You can customize Wrike’s interface to your needs and choose from a small selection of report templates.
One of the better features Wrike supports is the ability to collaborate with multiple team members on the same report, allowing you to pool resources to create a better presentation.
3. Hive
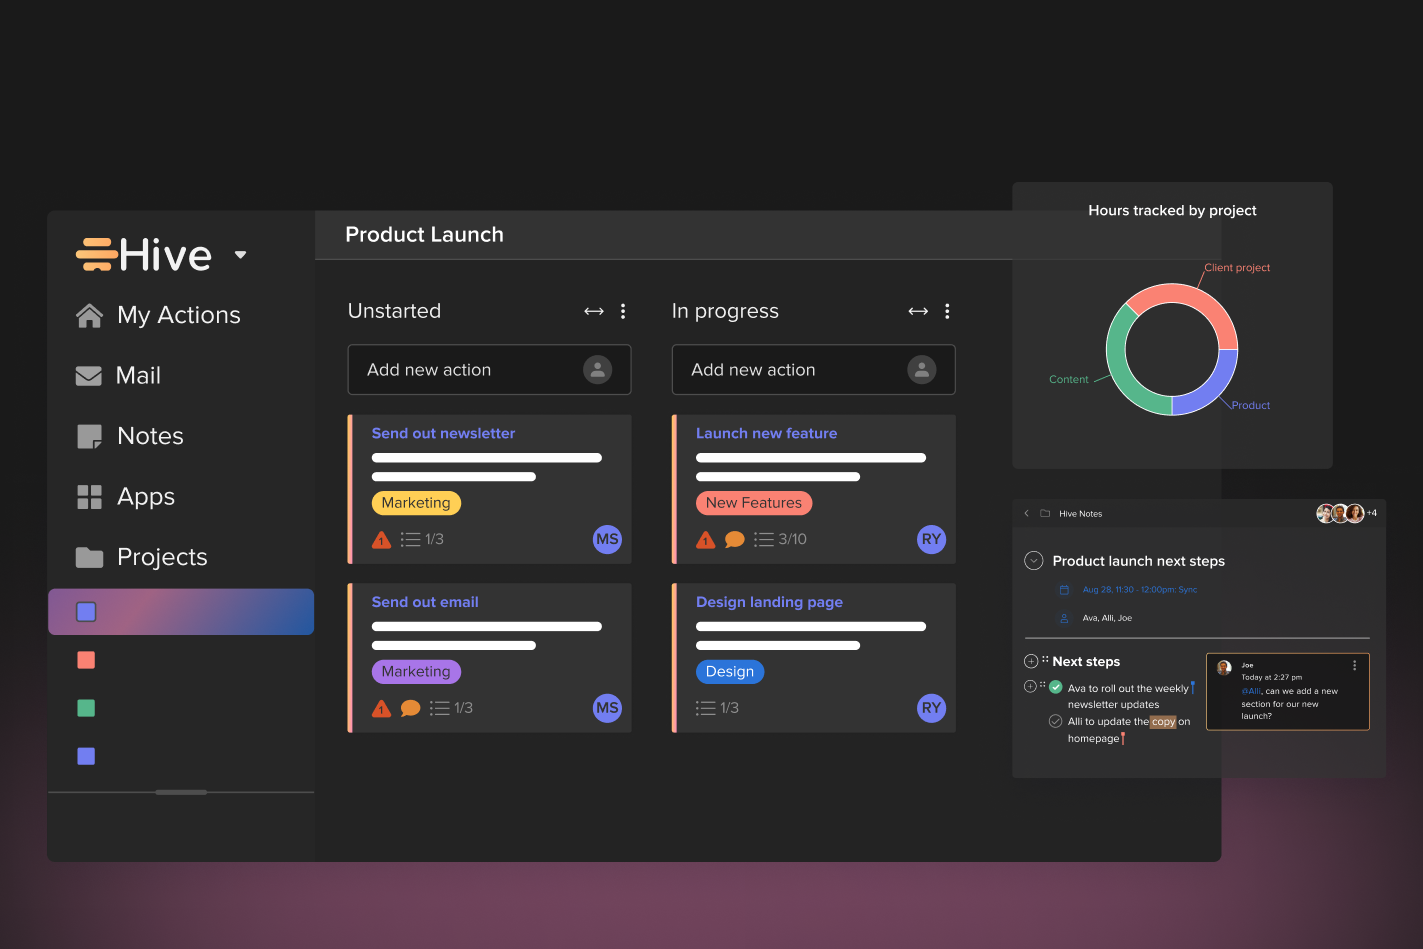
Hive takes its name seriously — it specializes in creating a “hive” of centralized data from a bunch of different sources. Hive then uses this data to help you get a bird’s eye view of your business that updates in real time. While Hive is a valuable reporting tool, it’s more of a plug-in than a full software suite.
To access more powerful presentation tools, you’ll need to connect Hive to other project management or reporting services or software.
4. Microsoft Power BI
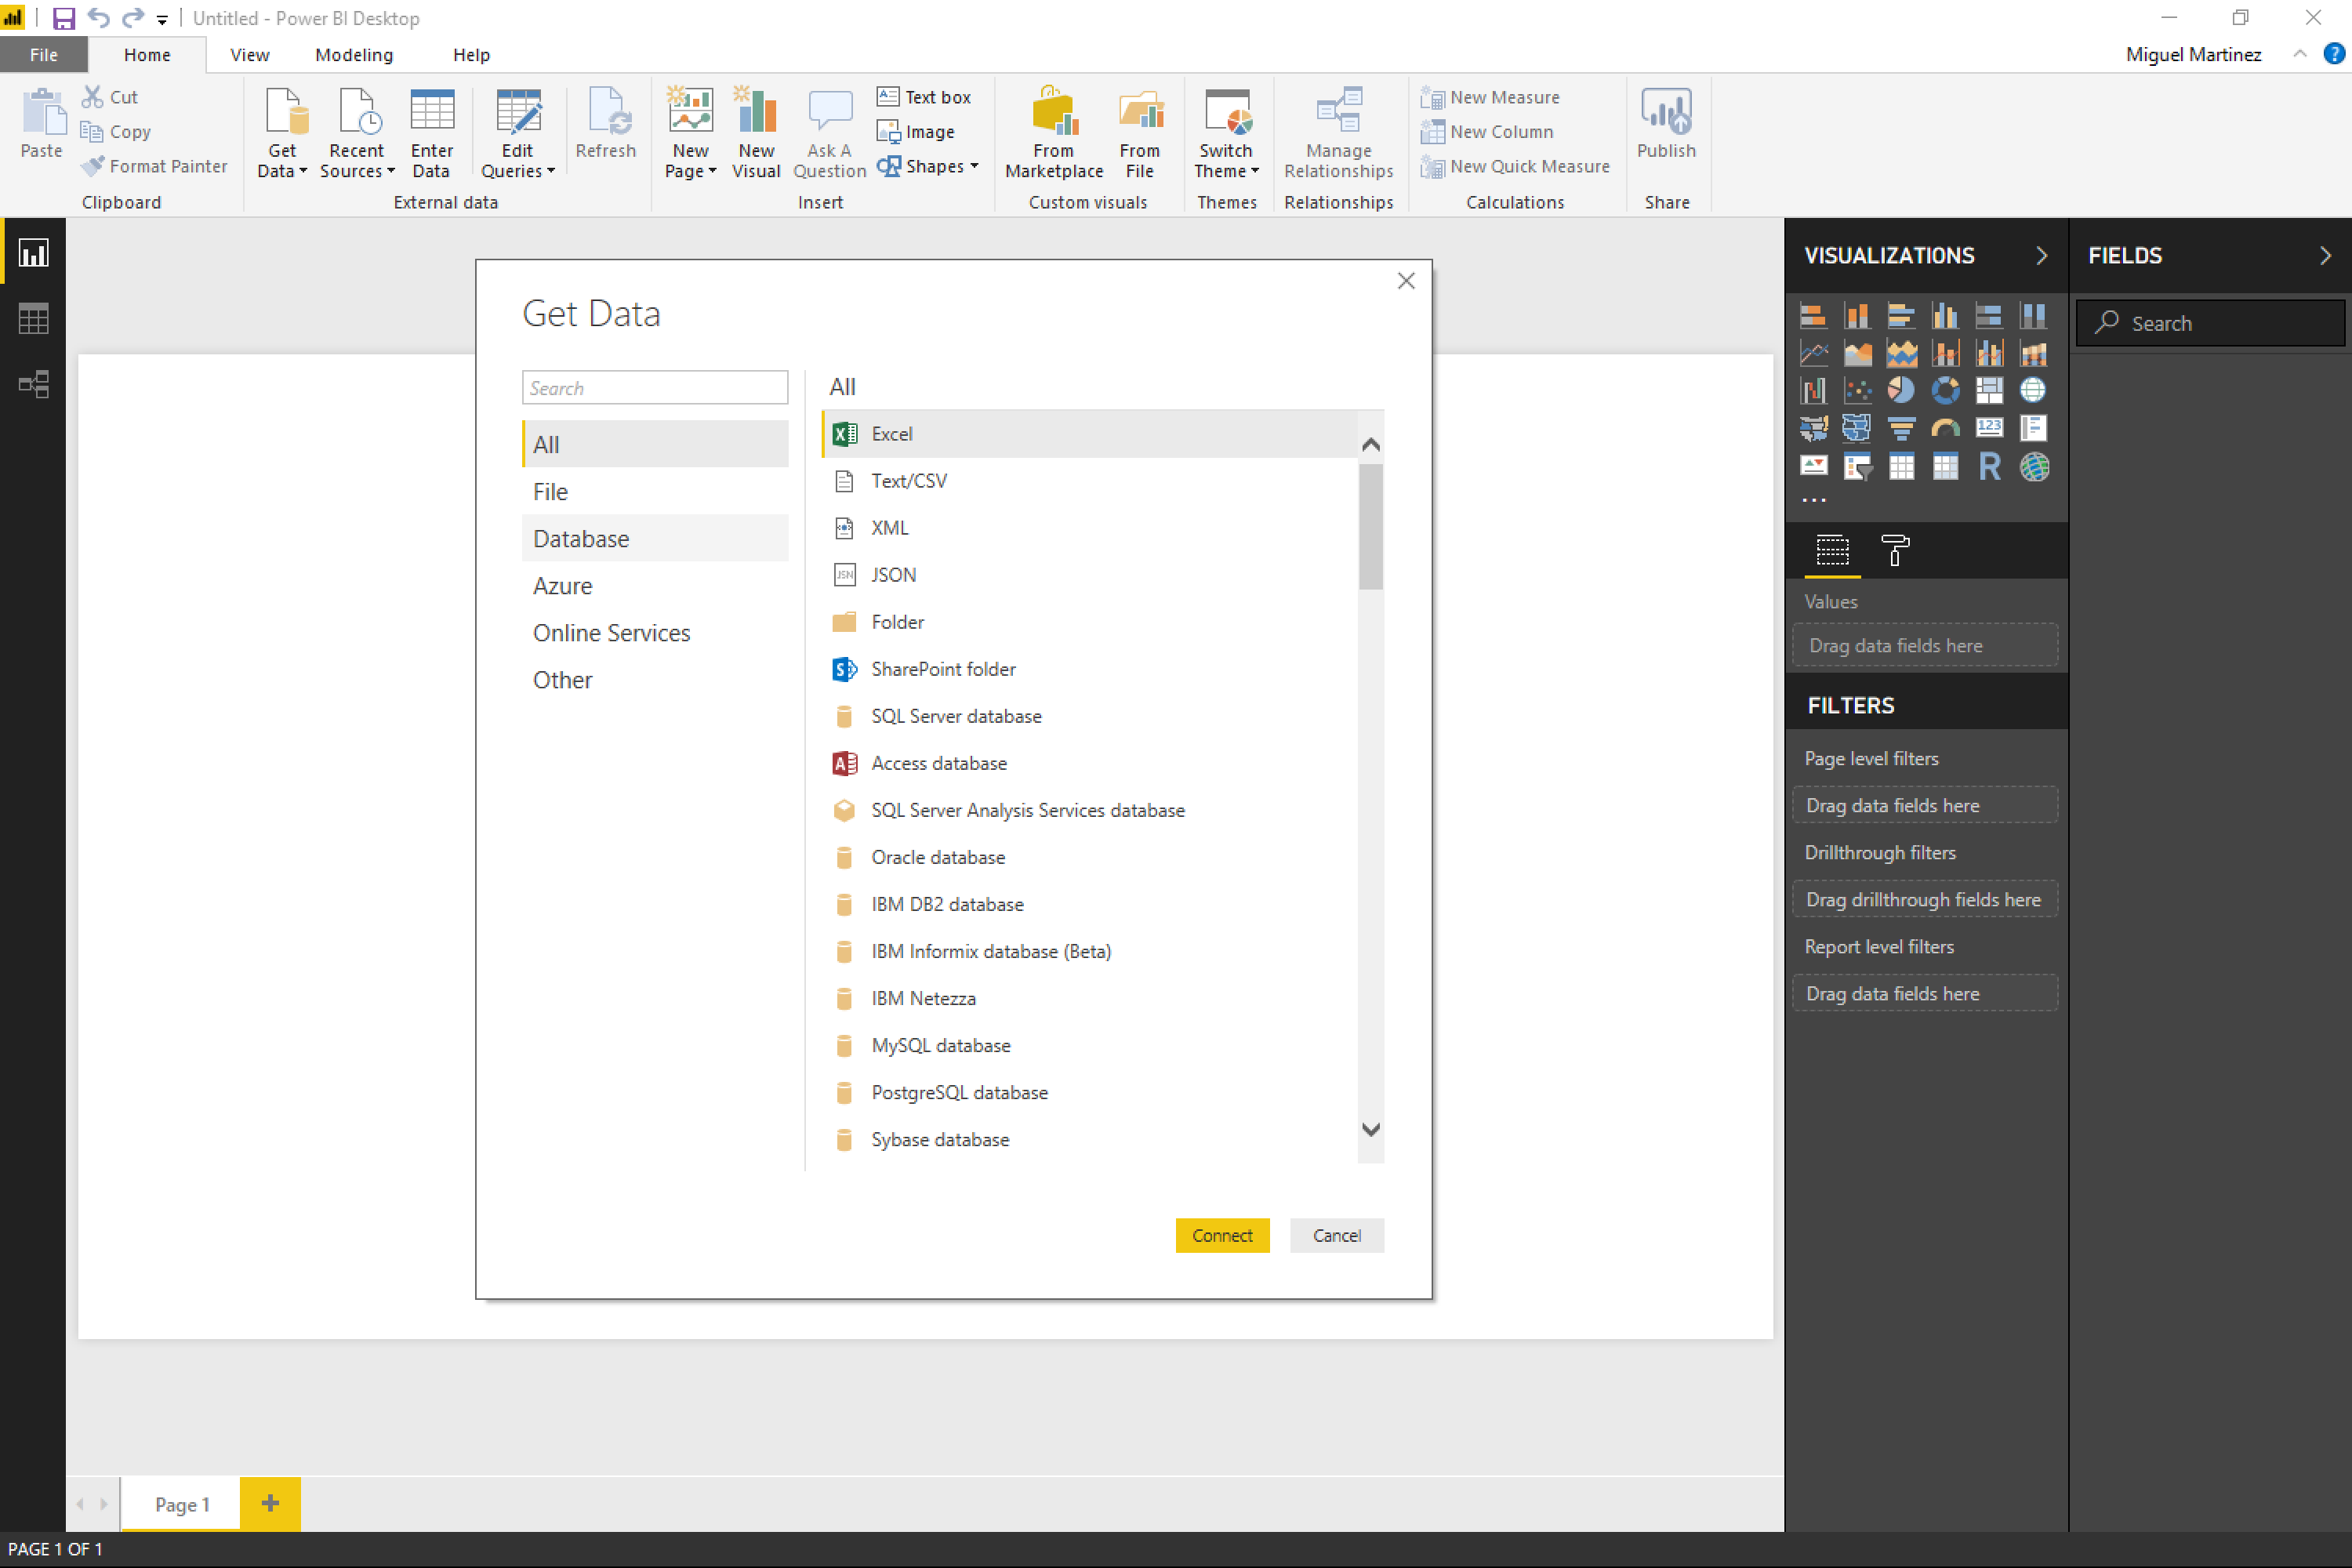
If you’re looking for a reporting tool that can scale up with your business, Power BI might be the right approach for you. This app can handle a large amount of data at the same time, a must-have feature for fast-growing businesses.
Primarily, Power BI functions as a data visualization tool with an emphasis on aesthetics. This is a great tool if you like to bring a little extra pizazz to your presentations.
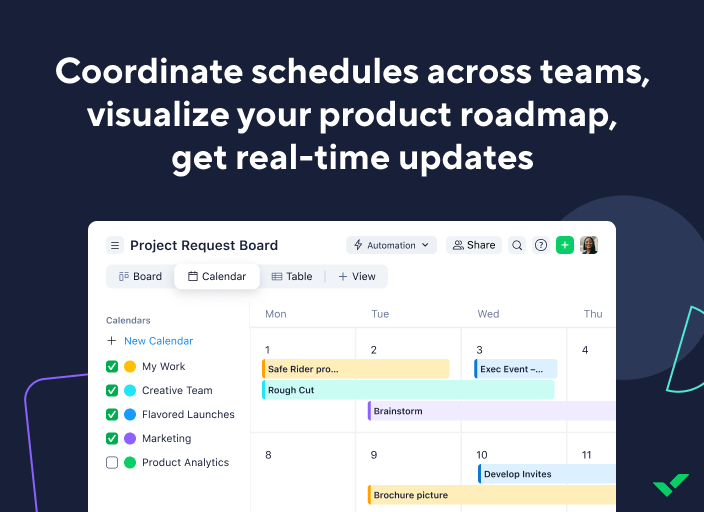
5. Whatagraph
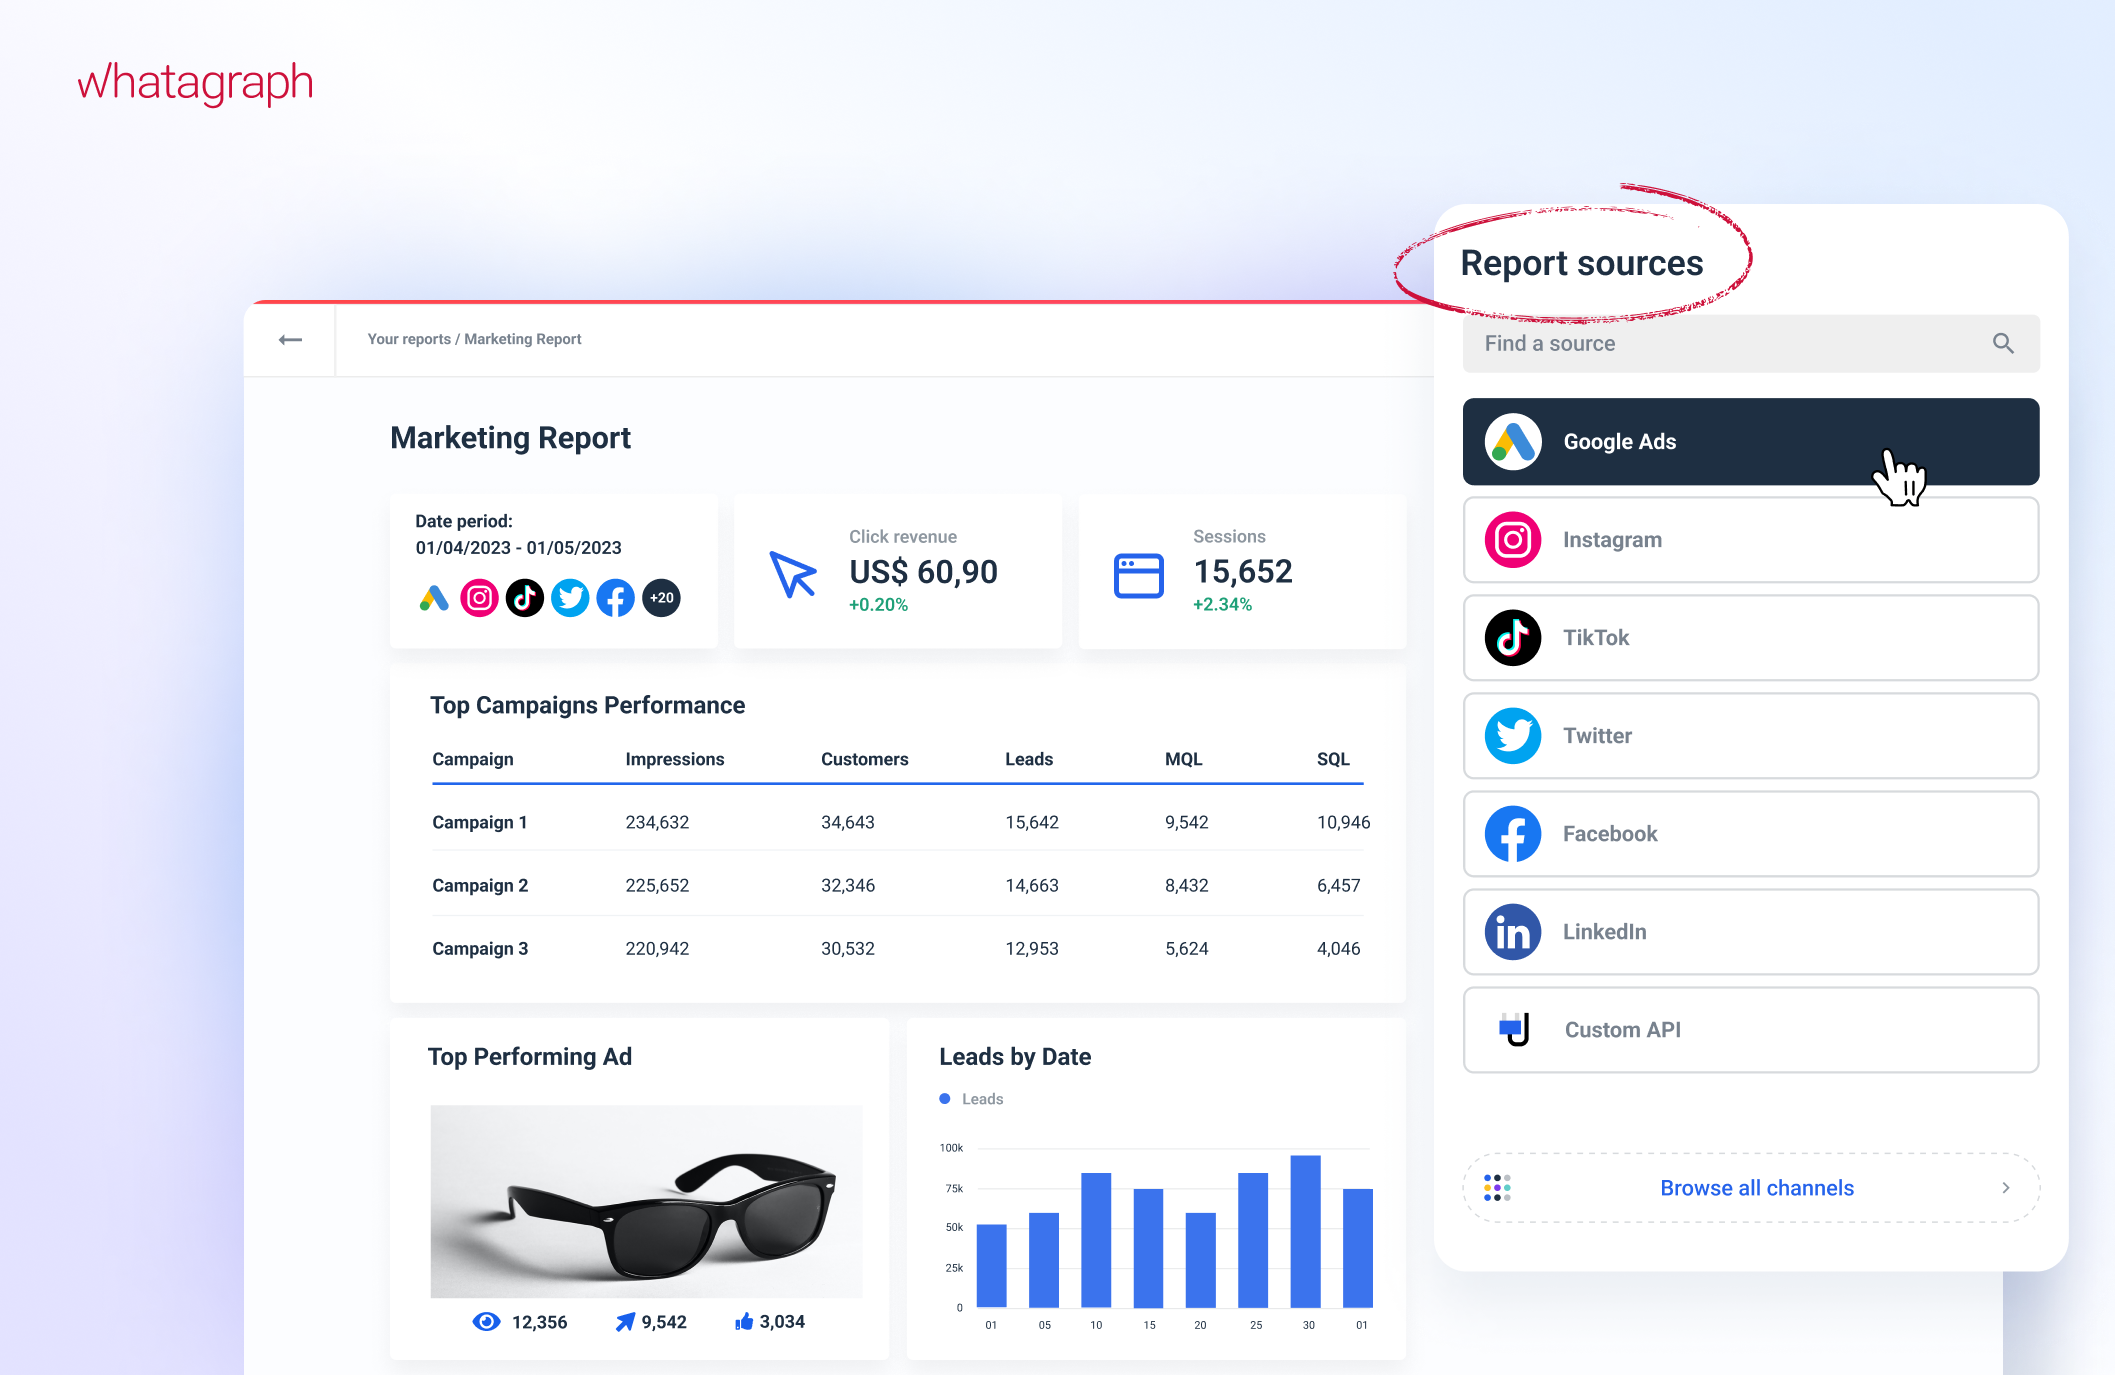
If you’re interested in looking at social media and marketing metrics, Whatagraph gives you a solid advantage. This reporting tool takes data from a company’s various channels and uses it to create reports to inform future campaigns. Whatagraph can also keep track of important key performance indicators (KPIs) to ensure your marketing efforts stay on target.
There’s no one-size-fits-all option for companies looking to create clear and meaningful reports. Reporting tools and software come in so many different formats precisely because a single service could never hope to fulfill the needs of every business in every industry.
But once you do find the right tool for your business, you’ll notice the difference in your reporting abilities when you’re gearing up for your next big meeting.
Photo by Sora Shimazaki


Send Comment: