Microsoft Excel is known for making data storage and organization more manageable, going far beyond the simple organization of rows and columns. But some users may overlook Excel’s ability to make tedious work much more efficient.
Formulas in Excel can save you a lot of time and manual work. It’s all about knowing what to use — and when. If you find yourself spending a lot of time in your Excel spreadsheets, there’s a good chance a formula could speed up the process.
What is standard deviation?
Standard deviation is a statistic that measures the dispersion of a dataset, relative to its mean. It’s calculated as the square root of the variance (the spread of numbers in a dataset). Determining the variation between each data point relative to the mean is valuable for comparing sets of data that may have the same mean but a different range.
For example, the mean of the following two data sets is the same, but the latter is clearly more spread out:
- 15, 15, 15, 14, 16
- 2, 7, 14, 22, 30
If the data points are further from the mean, the deviation within the dataset is higher. The more spread out the data, the higher the standard deviation, says Investopedia.
Standard deviation is often used in finance. It’s applied to the annual rate of return of an investment. The higher the standard deviation, the greater the variance between each price and the mean, which reveals a larger price range. Volatile stock has a high standard deviation, but blue-chip stock (a large company with a positive reputation) has a low standard deviation.
Just so you know
Sign up for a free Jotform account to create powerful online forms in minutes — with no coding required.
Using standard deviation
Standard deviation is used to strategize investing and trading, because it can help you measure market volatility. Analysts, portfolio managers, and advisors use standard deviation as a fundamental risk measure. Investment firms will even report the standard deviation of their mutual funds.
The statistics are typically easy to understand, which is why it’s useful to show them to clients and investors — and using Excel to calculate and display the standard deviation can be extremely valuable in terms of time management.
How to calculate the standard deviation in Excel
Excel makes calculating standard deviation more manageable. But first, it’s important to understand the six standard deviation formulas in Excel.
- To calculate the sample standard deviation, use formulas in this category: STDEV.S, STDEVA, and STDEV.
- To calculate the standard deviation for an entire population, use formulas in this category: STDEV.P, STDEVPA, and STDEVP.
The term population means that you’re considering all the datasets in an entire population. If using the entire population is unrealistic or impossible, using a sample from the population (sample standard deviation) will work. Typically, you can find the standard deviation by using the sample data to calculate the standard deviation and then infer the entire population.
Focusing on the more typical practice of using a sample of the data as opposed to the population, these are the three formulas — explained:
- STDEV.S. This formula is used when data is numeric, which means that it will ignore text and logical values.
- STDEVA. This formula is used when text and logical values are included in the calculation along with numbers. Text and “FALSE” are read as 0, and TRUE is understood as 1.
- STDEV. This formula is compatible with older versions of Excel (2007 or prior) but completes the same function as STDEV.S (which is used in any Excel software after 2007).
Using the STDEV.S function
To reiterate, STDEV.S uses numerical values and ignores text and logical values.
The syntax of the STDEV.S function used in Excel is STDEV.S(number1,[number 2],…).
- Number1. This number is a mandatory argument in the formula. The first number corresponds to the first element of the sample. Instead of arguments separated by commas, a named range, single array, or a reference to an array can be used here.
- Number2. This is the optional argument in the formula. These can refer to a data point, a named range, a single array, or a reference to an array. Up to 254 additional arguments can be used.
In practice
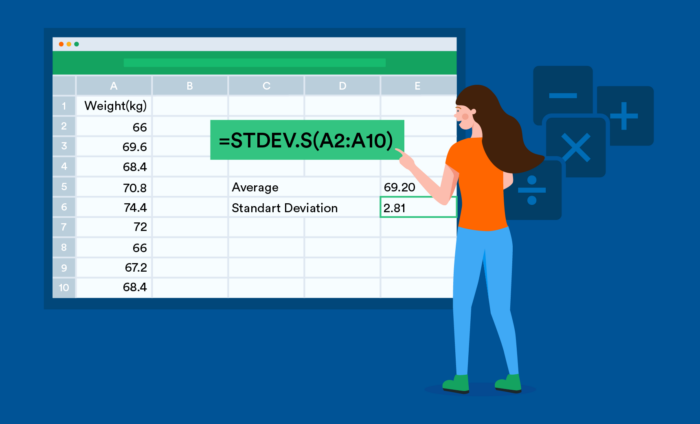
Say there’s a dataset for a range of weights from a sample of a population. Using the numbers listed in column A, the formula will look like this when applied: =STDEV.S(A2:A10).
In return, Excel will provide the standard deviation of the applied data, as well as the average. If the average was 150, and the standard deviation is 2, that would mean that most people in the group were within the weight range of 150–2 or 150+2.
Pro Tip
When a formula is entered into a cell, it will also appear in Excel’s Formula bar. Always make sure to include an equal sign when entering a formula.
For more information on using formulas in Excel, and other useful tricks for mastering the software, check out Jotform’s Excel guide.
For your information
This article was written by a real person. No part of the content was generated using AI.


Send Comment:
1 Comments:
More than a year ago
How to l copy excel sheet to another workbook VBA