Mobile devices allow you to browse online no matter whether you’re at home on the couch or out comparison shopping in the store.
While browsing might be more convenient on mobile, entering information can be a far bigger hassle. Typing with the touchscreen keyboard and battling autocorrect are some challenges mobile users face that desktop users don’t have to worry about.
At Jotform, we help our customers create and embed forms on their websites. We also want to help our customers understand how their visitors’ device of choice affects their likelihood of completing forms. Using records of each time one of our users displayed a payment form, and whether that form was submitted, we investigated how submission rates differed between mobile and desktop users.
We looked at form views and submissions coming from mobile and desktop devices. We broke the numbers out according to the length and industry of the form, as well as the country of the user. Desktop devices have higher submission rates overall – 81% higher than mobile. Longer forms were two and a quarter times more likely to be submitted on desktop, and both country and industry affect how many views it takes to get a submitted form.
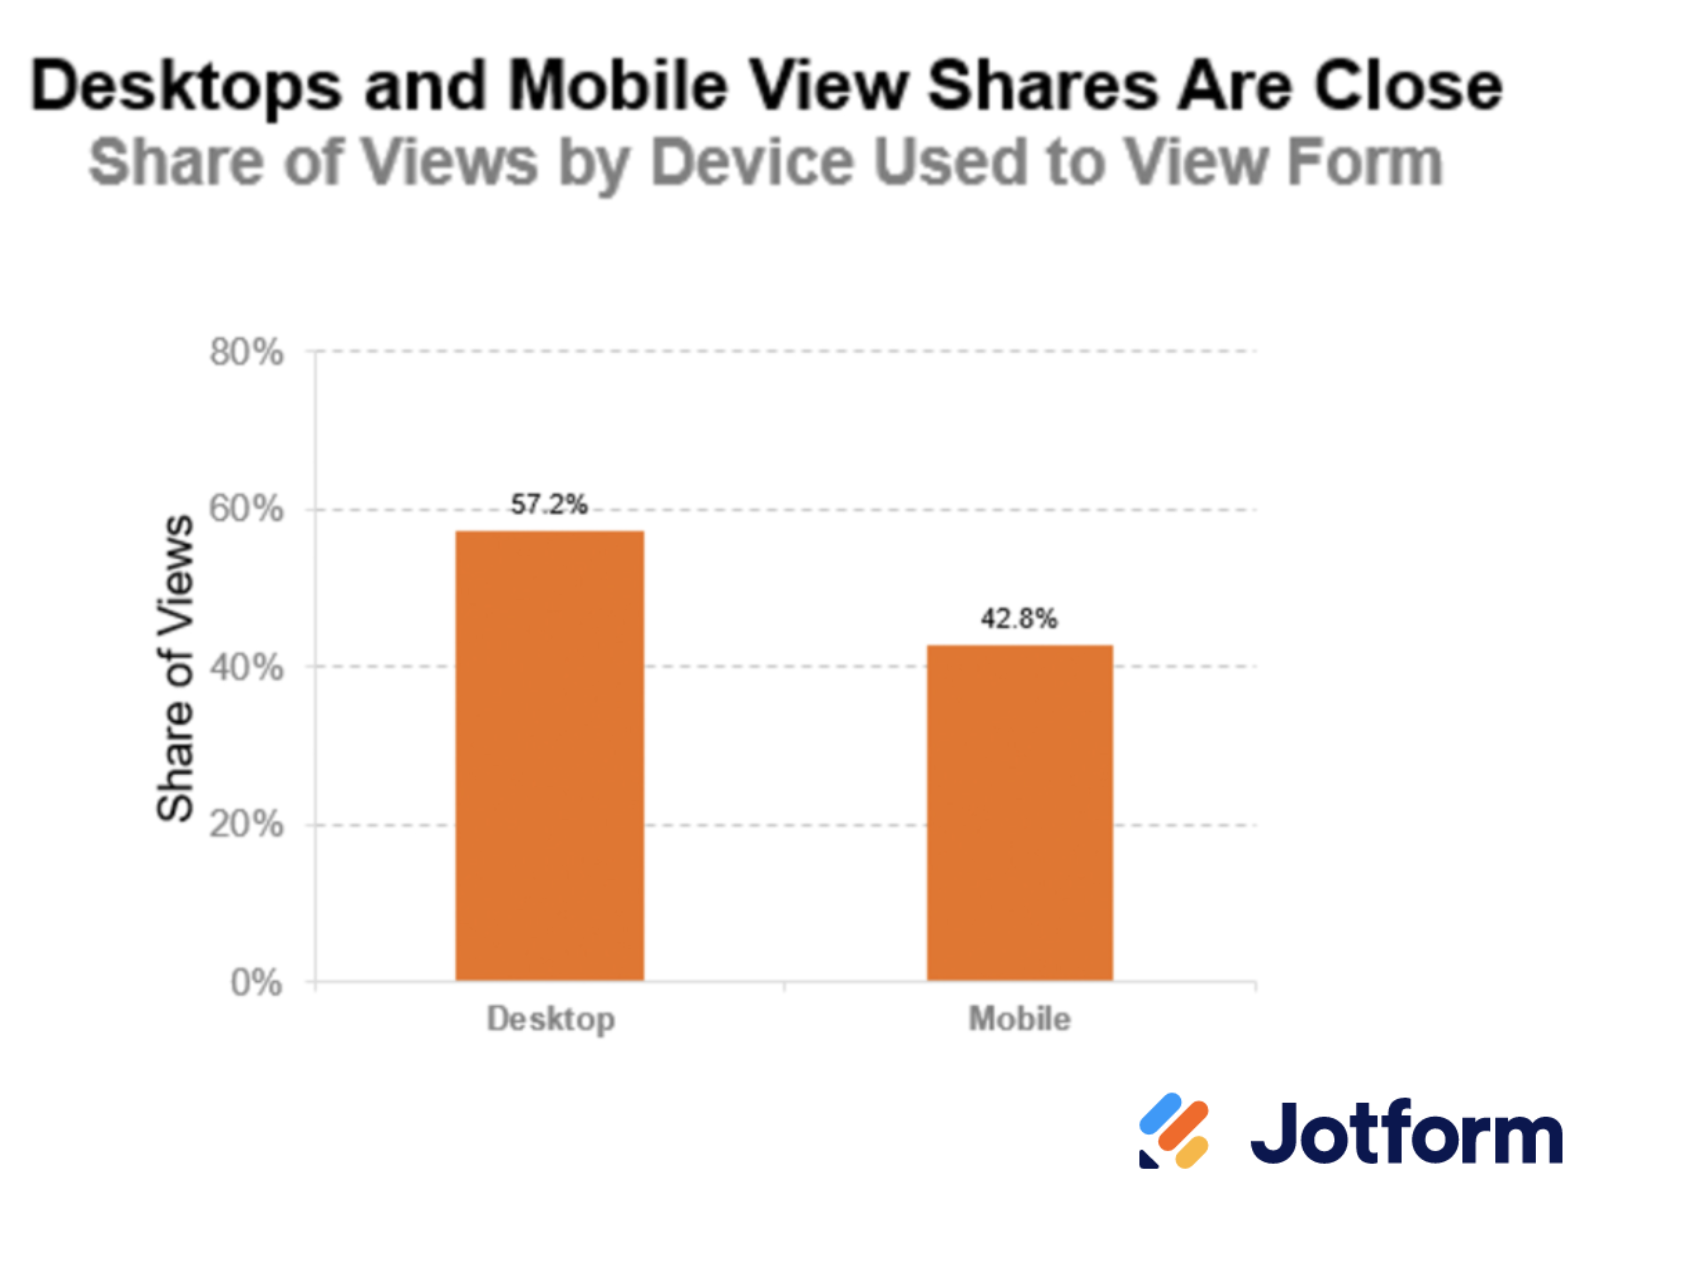
We wanted to see what device people use more often to open forms. Looking across all views, we totaled up the number of forms displayed on desktop and the number displayed on mobile. Then, we divided the total number of views into each device’s total to get the share of views.
Desktop is the more frequently used platform, making up 57.2% of all views. Mobile is not too far behind, however, with 42.8% of views. While there’s a slight preference for viewing forms on desktop, the two platforms appear with fairly balanced frequency.
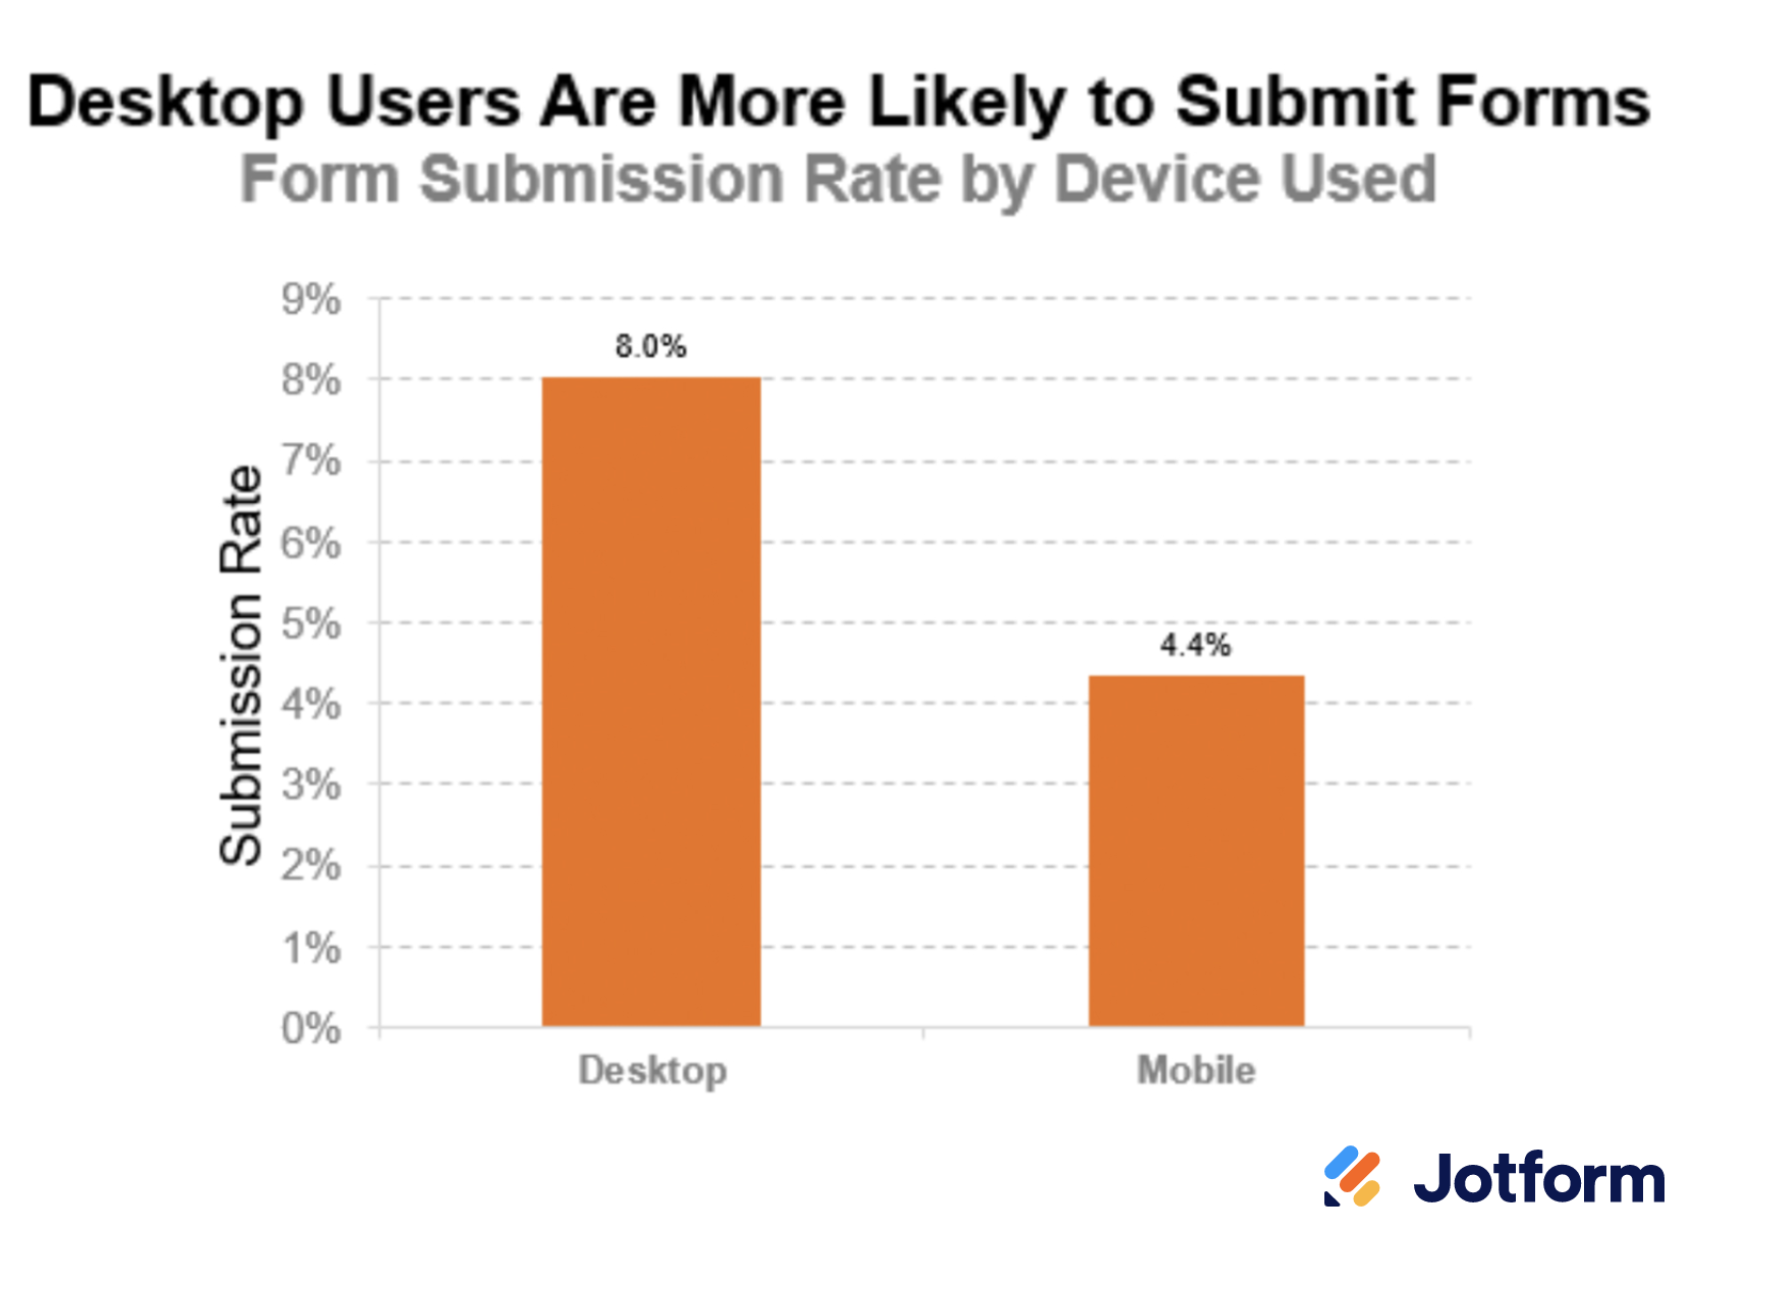
Getting a user to view a form is only part of the challenge. We wanted to see how submission rates compared between desktop and mobile. We took the total number of views for each platform, and divided that into how many views ended with a submission. The result is how many submissions result from 100 views on average.
While the view shares were near balanced between the two device types, submission rates are not. Desktop users submitted 8 out of 100 forms, nearly double the 4.4 out of 100 forms for mobile users. Our data includes views and submissions from a wide variety of forms, so we wanted to break the numbers down further.
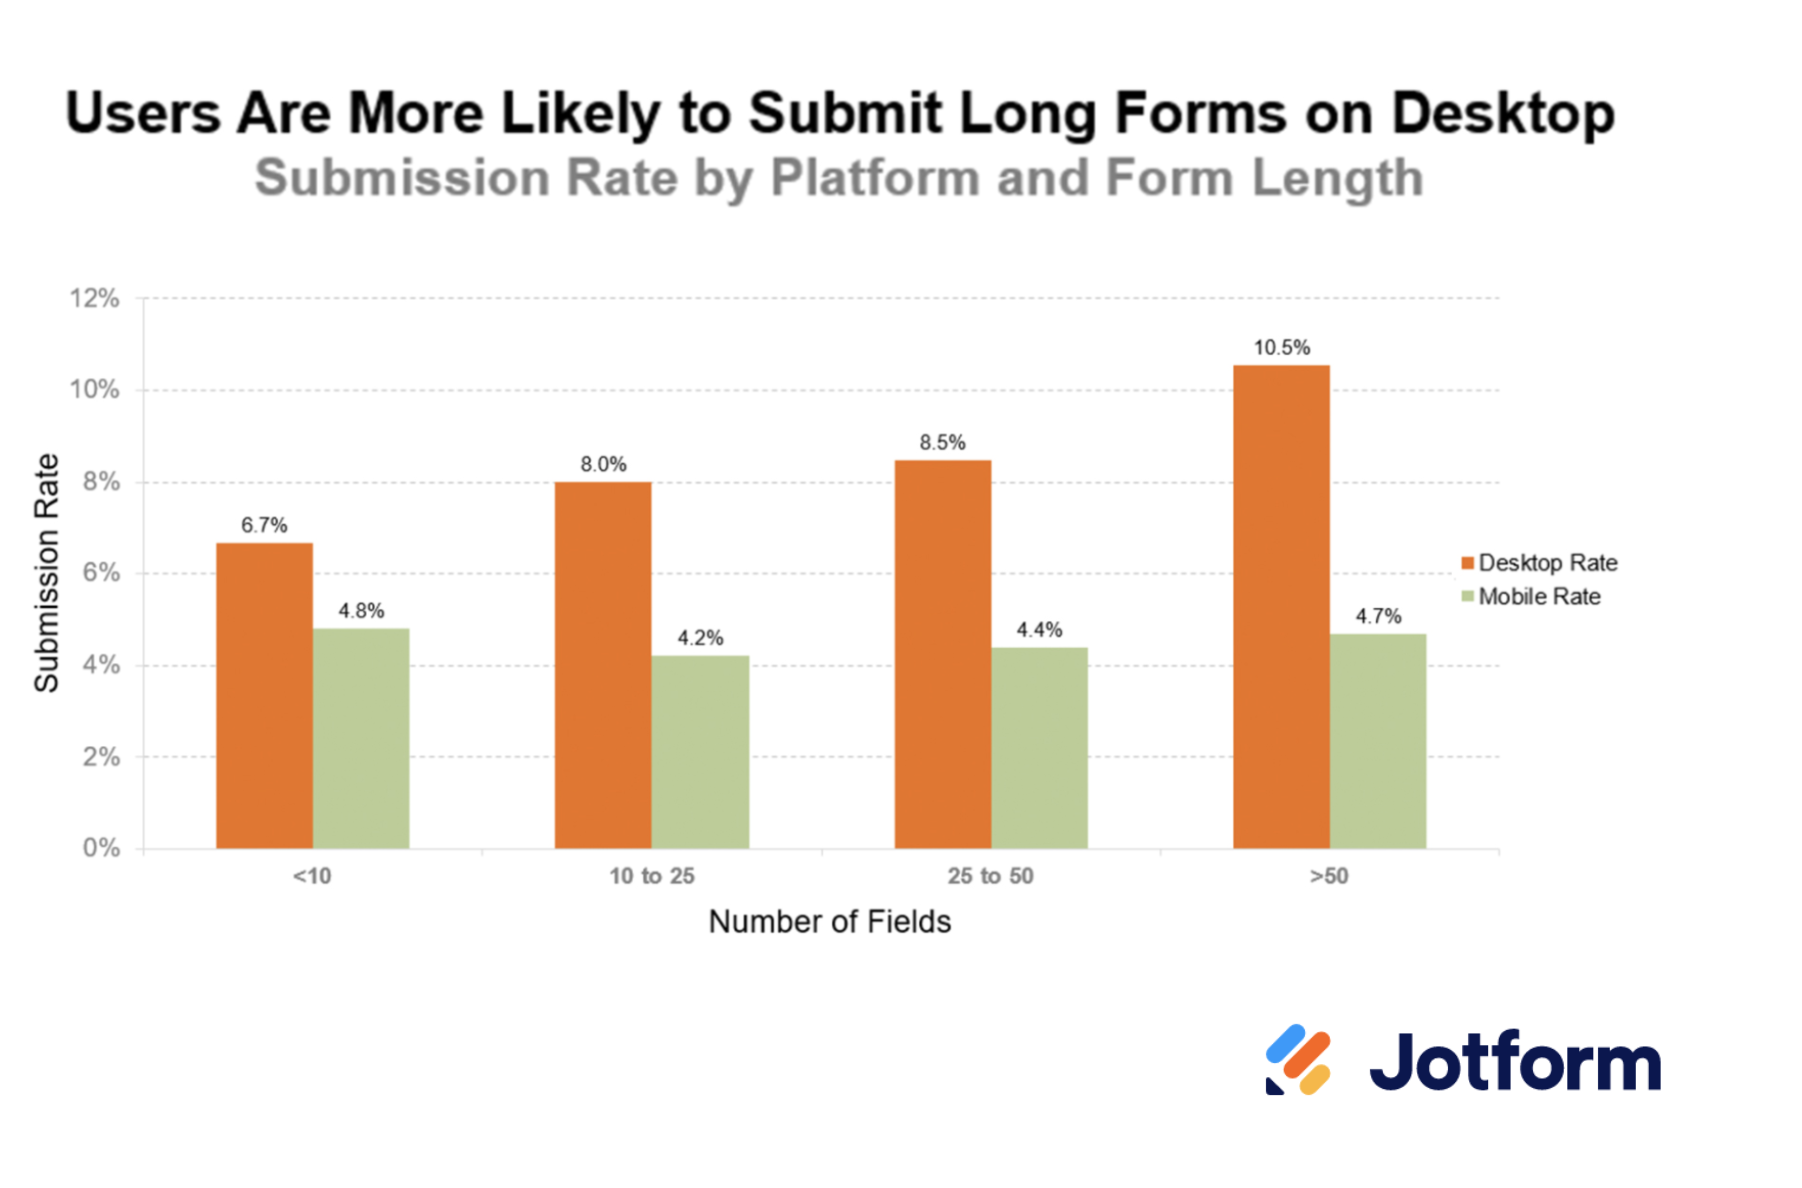
Mobile devices make browsing very accessible, but it can be a pain to complete some tasks on a phone or tablet that may be less taxing on desktop. How does form length affect submission rates for mobile and desktop? We took the number of views and submissions for both platforms and split according to the number of fields in the form.
Mobile submission rates stay relatively level as form length increases. Desktop rates go up 57% from the shortest forms to the longest. While longer forms have higher submission rates on desktop, they also have fewer views and submissions in total. These very long forms may also be “compulsory” which is why people will actually complete a form with 50+ fields.
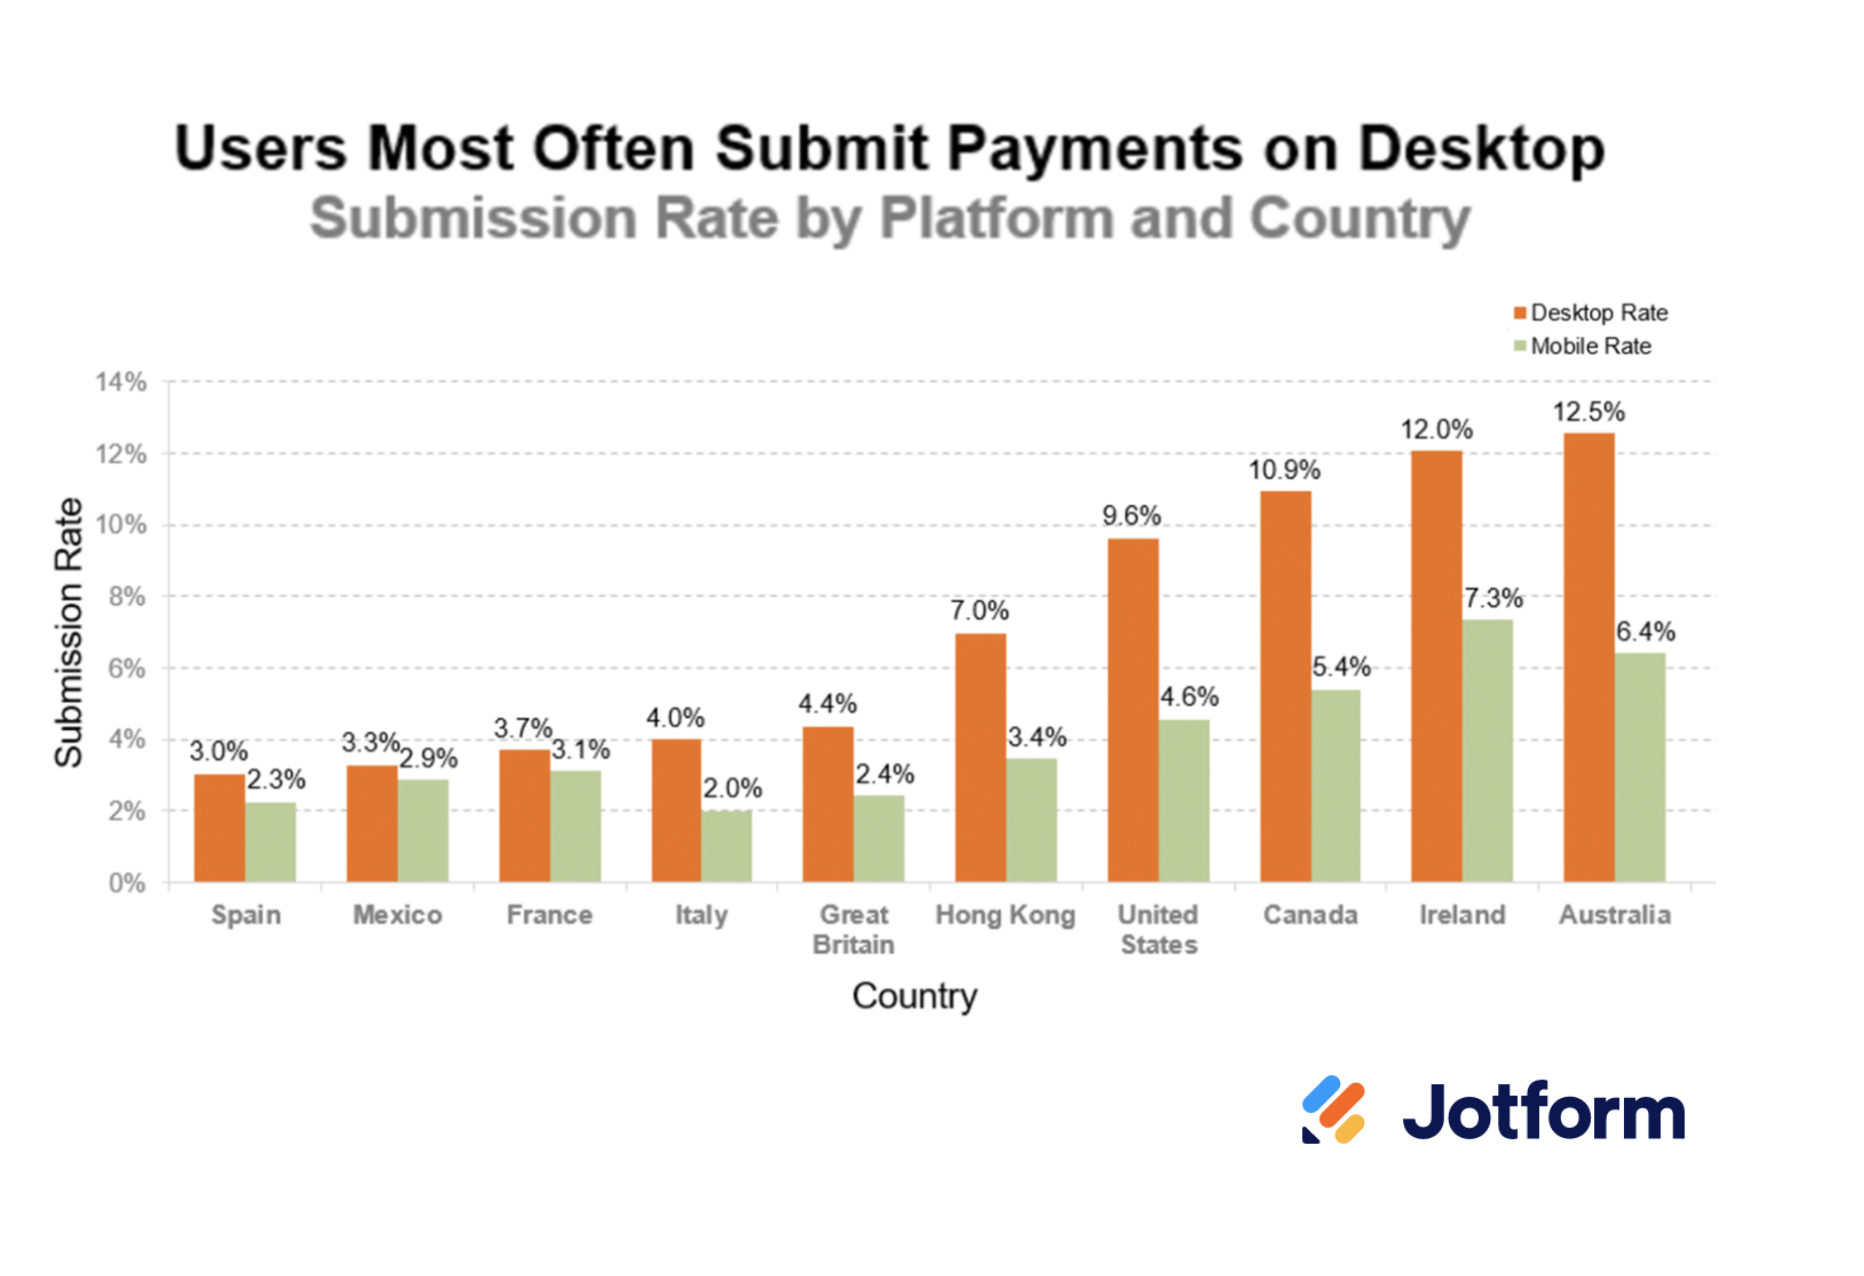
Next we wanted to see how a user’s country affected their submission rates. We used IP addresses to identify from which country users viewed and submitted forms. We then broke out the number of views and submissions for each device by country.
Desktop users submitted at a higher rate than mobile users in all 10 countries. Users in Ireland and Australia had the highest submission rates for both platforms, with 12.0% and 12.5% on desktop and 7.3% and 6.4% on mobile. Users from countries with lower submission rates are closer to equal between the two platforms.
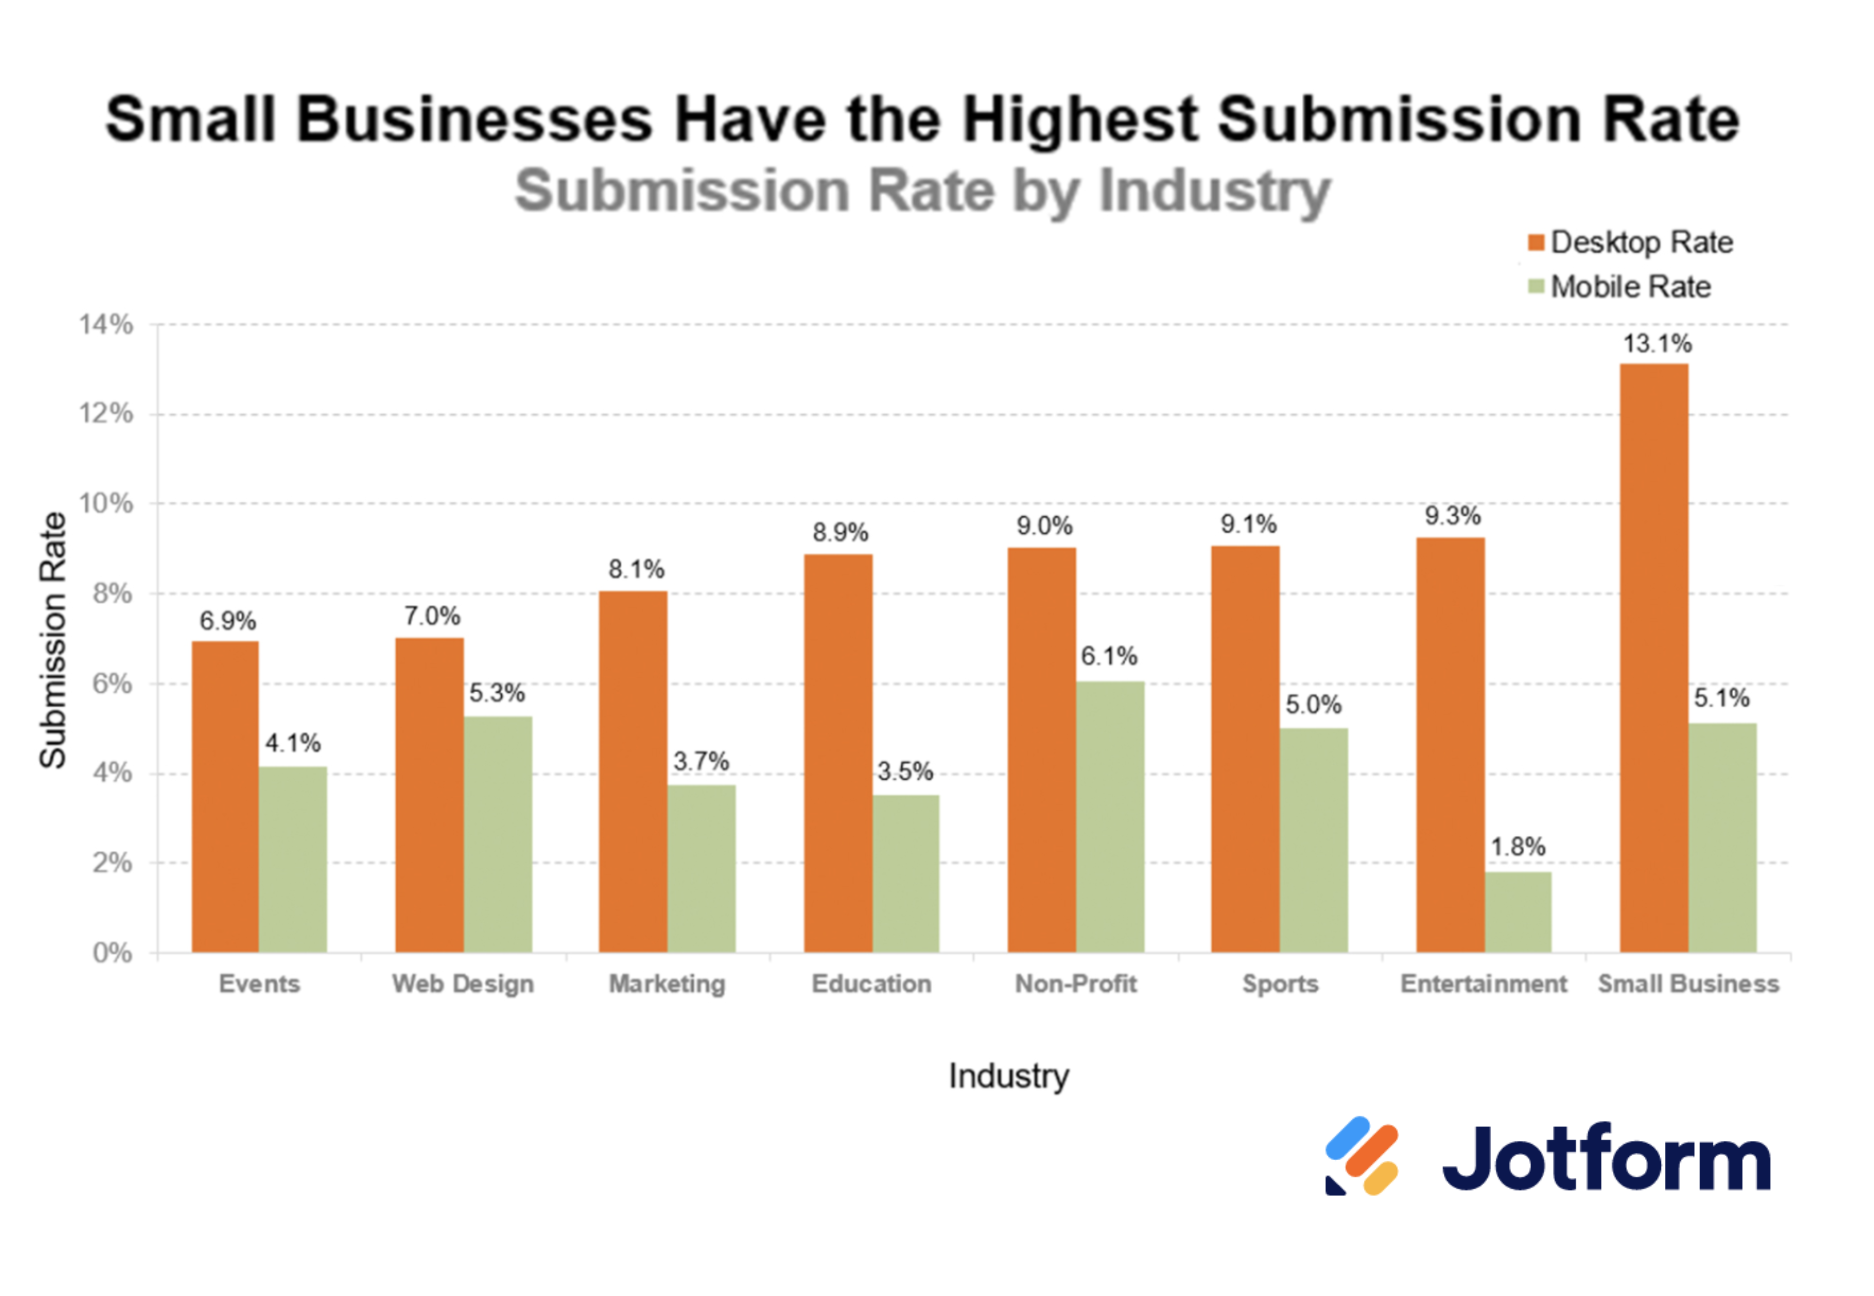
We wanted to see if there was any difference in submission rates between different industries. We labeled each form by industry and calculated the submission rates for both mobile and desktop for each industry.
Desktop rates again are higher in every category than mobile submission rates. Small business forms have the highest submission rate overall, 90% higher than the Events industry, which has the lowest desktop submission rate. The entertainment industry has the lowest mobile submission rate, 30% of the non-profit industry’s submission rate.
We looked at form views and submissions across mobile and desktop devices. Users viewed forms at fairly similar rates between desktop and mobile, but were 81% more likely to submit on desktop. Submission rates on desktop increase as form length increases, but have fewer views and submission in total. The country the user is from and the industry both play a role in the how many views it takes to generate a submission.



Send Comment:
1 Comments:
More than a year ago
Recently I have had a number of contributors who are trying to use my forms but state that once filled in they can not send the form, can you advise what I need to do, please?