
When I became a content marketing specialist, I thought I had left my college statistics days behind — but I was wrong. I soon discovered that I need to know what I’m looking at before I can create client reports and check on performance. And that is where tools that leverage AI for statistics come in.
In this post, I transport myself back to my sophomore year statistics lab course, with a little help from AI. Unlike the more hands-on tools from back then, these AI-powered statistical analysis platforms help data scientists, researchers, analysts, and nontechnical business users make sense of their data.
Keep reading to discover my thoughts on some of the best AI for statistics and what they can do for you.
8 best AI tools for statistics: A quick comparison
Datapad | Julius AI |  Tableau | Desmos |  Dataiku | Gemini | Minitab | ChatGPT | |
|---|---|---|---|---|---|---|---|---|
| Best for | Proactive KPI monitoring and autonomous data analysis | Natural language data querying | Enterprise data visualization | Interactive statistical visualizations | Enterprise data science and AI workflows | Multi-modal AI data analytics | Professional statistical analysis | Conversational data analysis |
| You should know | Instant statistical insights and proactive tracking of your KPIs | File uploads and questions in plain English generate statistical analysis | The gold standard for data visualization with AI-powered insights | Free online statistical calculator with advanced features | Collaborative data science platform for teams to build data-based products | Integrated AI analysis across Google Docs, Sheets, and Drive | Comprehensive suite of statistical, data analysis, and process improvement tools for trend analysis and problem-solving | Advanced Data Analysis feature enables sophisticated statistical computing |
| Cost | Free plan available Basic plan: $20/month $16/month (annual) | Free plan available Plus plan: $20/month $16/month (annual) | Contact for pricing | Free | Free plan available Contact for pricing | Google AI Pro: $20/month Google AI Ultra: $249.99/month | Starts at $1,851/year | Business plan: $25/month |
How I tested AI tools for statistics
To put these AI tools to the test, I took a look at several key features:
- Data visualizations: Can the tool generate visual insights? How customizable are they?
- Automation: Can it detect patterns or trends without manual setup? Does it streamline repetitive analysis tasks?
- Learning curve: Does the tool guide users through analysis with prompts or suggestions? Are there templates or tutorials to help beginners get started?
- Tool integrations: Does it connect with tools like Jotform, Excel, Google Sheets, or customer relationship management systems (CRMs)? Can it pull in or push out data easily?
- User experience: Is the interface clean and intuitive? How easy is it to navigate and run analyses?
For each tool, I uploaded a sample dataset, evaluated what the platform could do with that data, and tested any conversational AI tools to see how friendly each would be to nontechnical users.
The 8 best AI tools for statistics
Now let’s see how the options stacked up. Keep reading to learn more about my top choices for AI-powered statistics tools.
1. Datapad
Best for: Autonomous business analytics
Developer: Datapad Inc.
You should know: Provides instant statistical insights and proactively tracks your key performance indicators (KPIs)
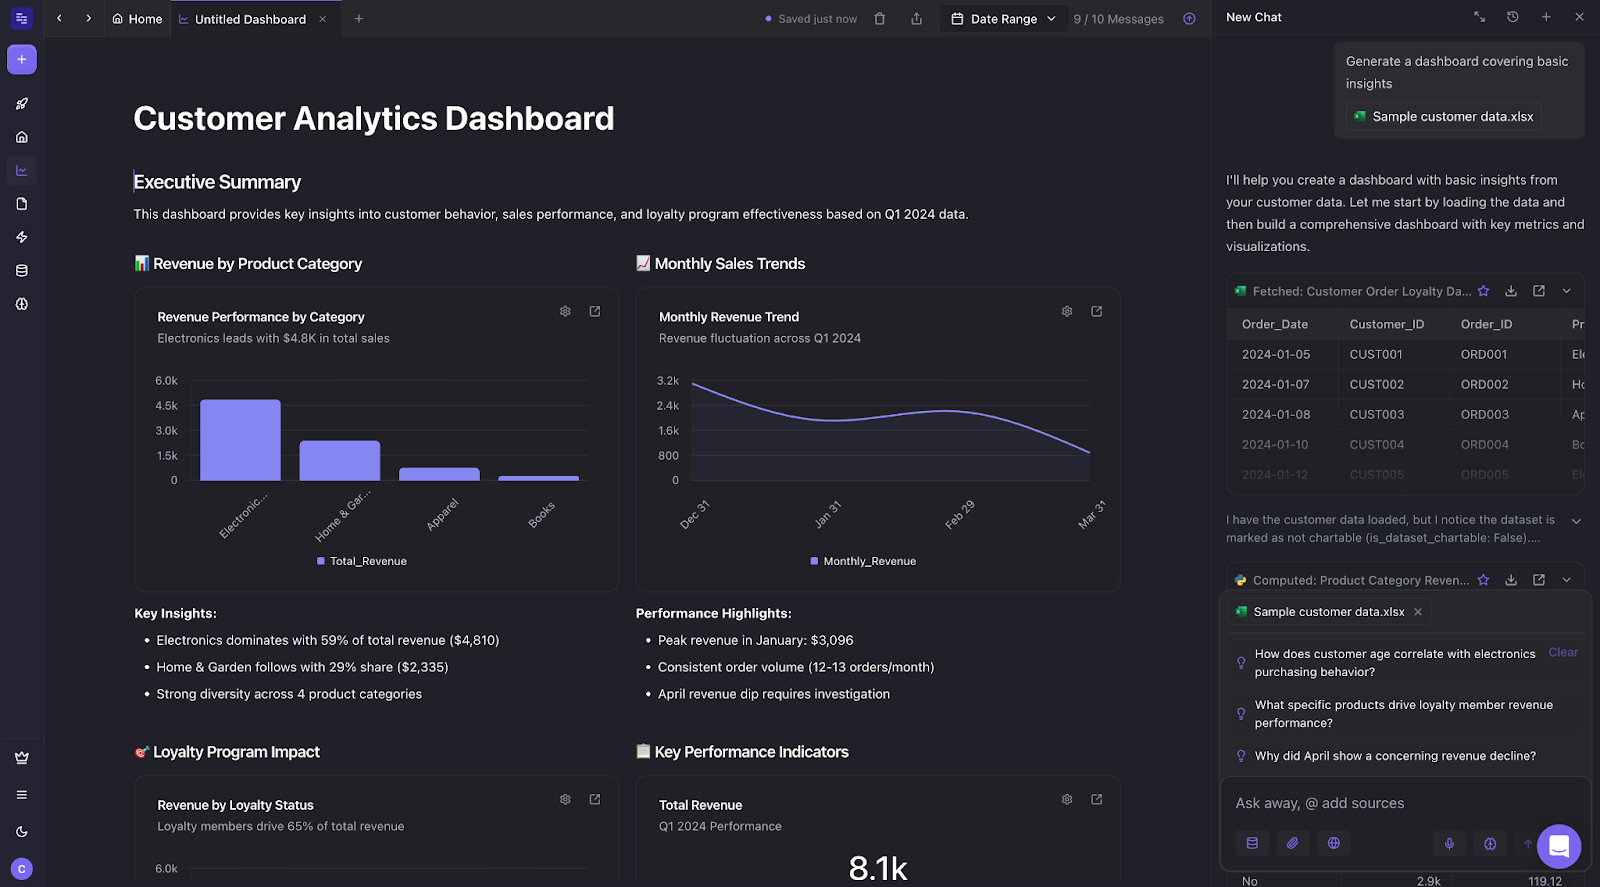
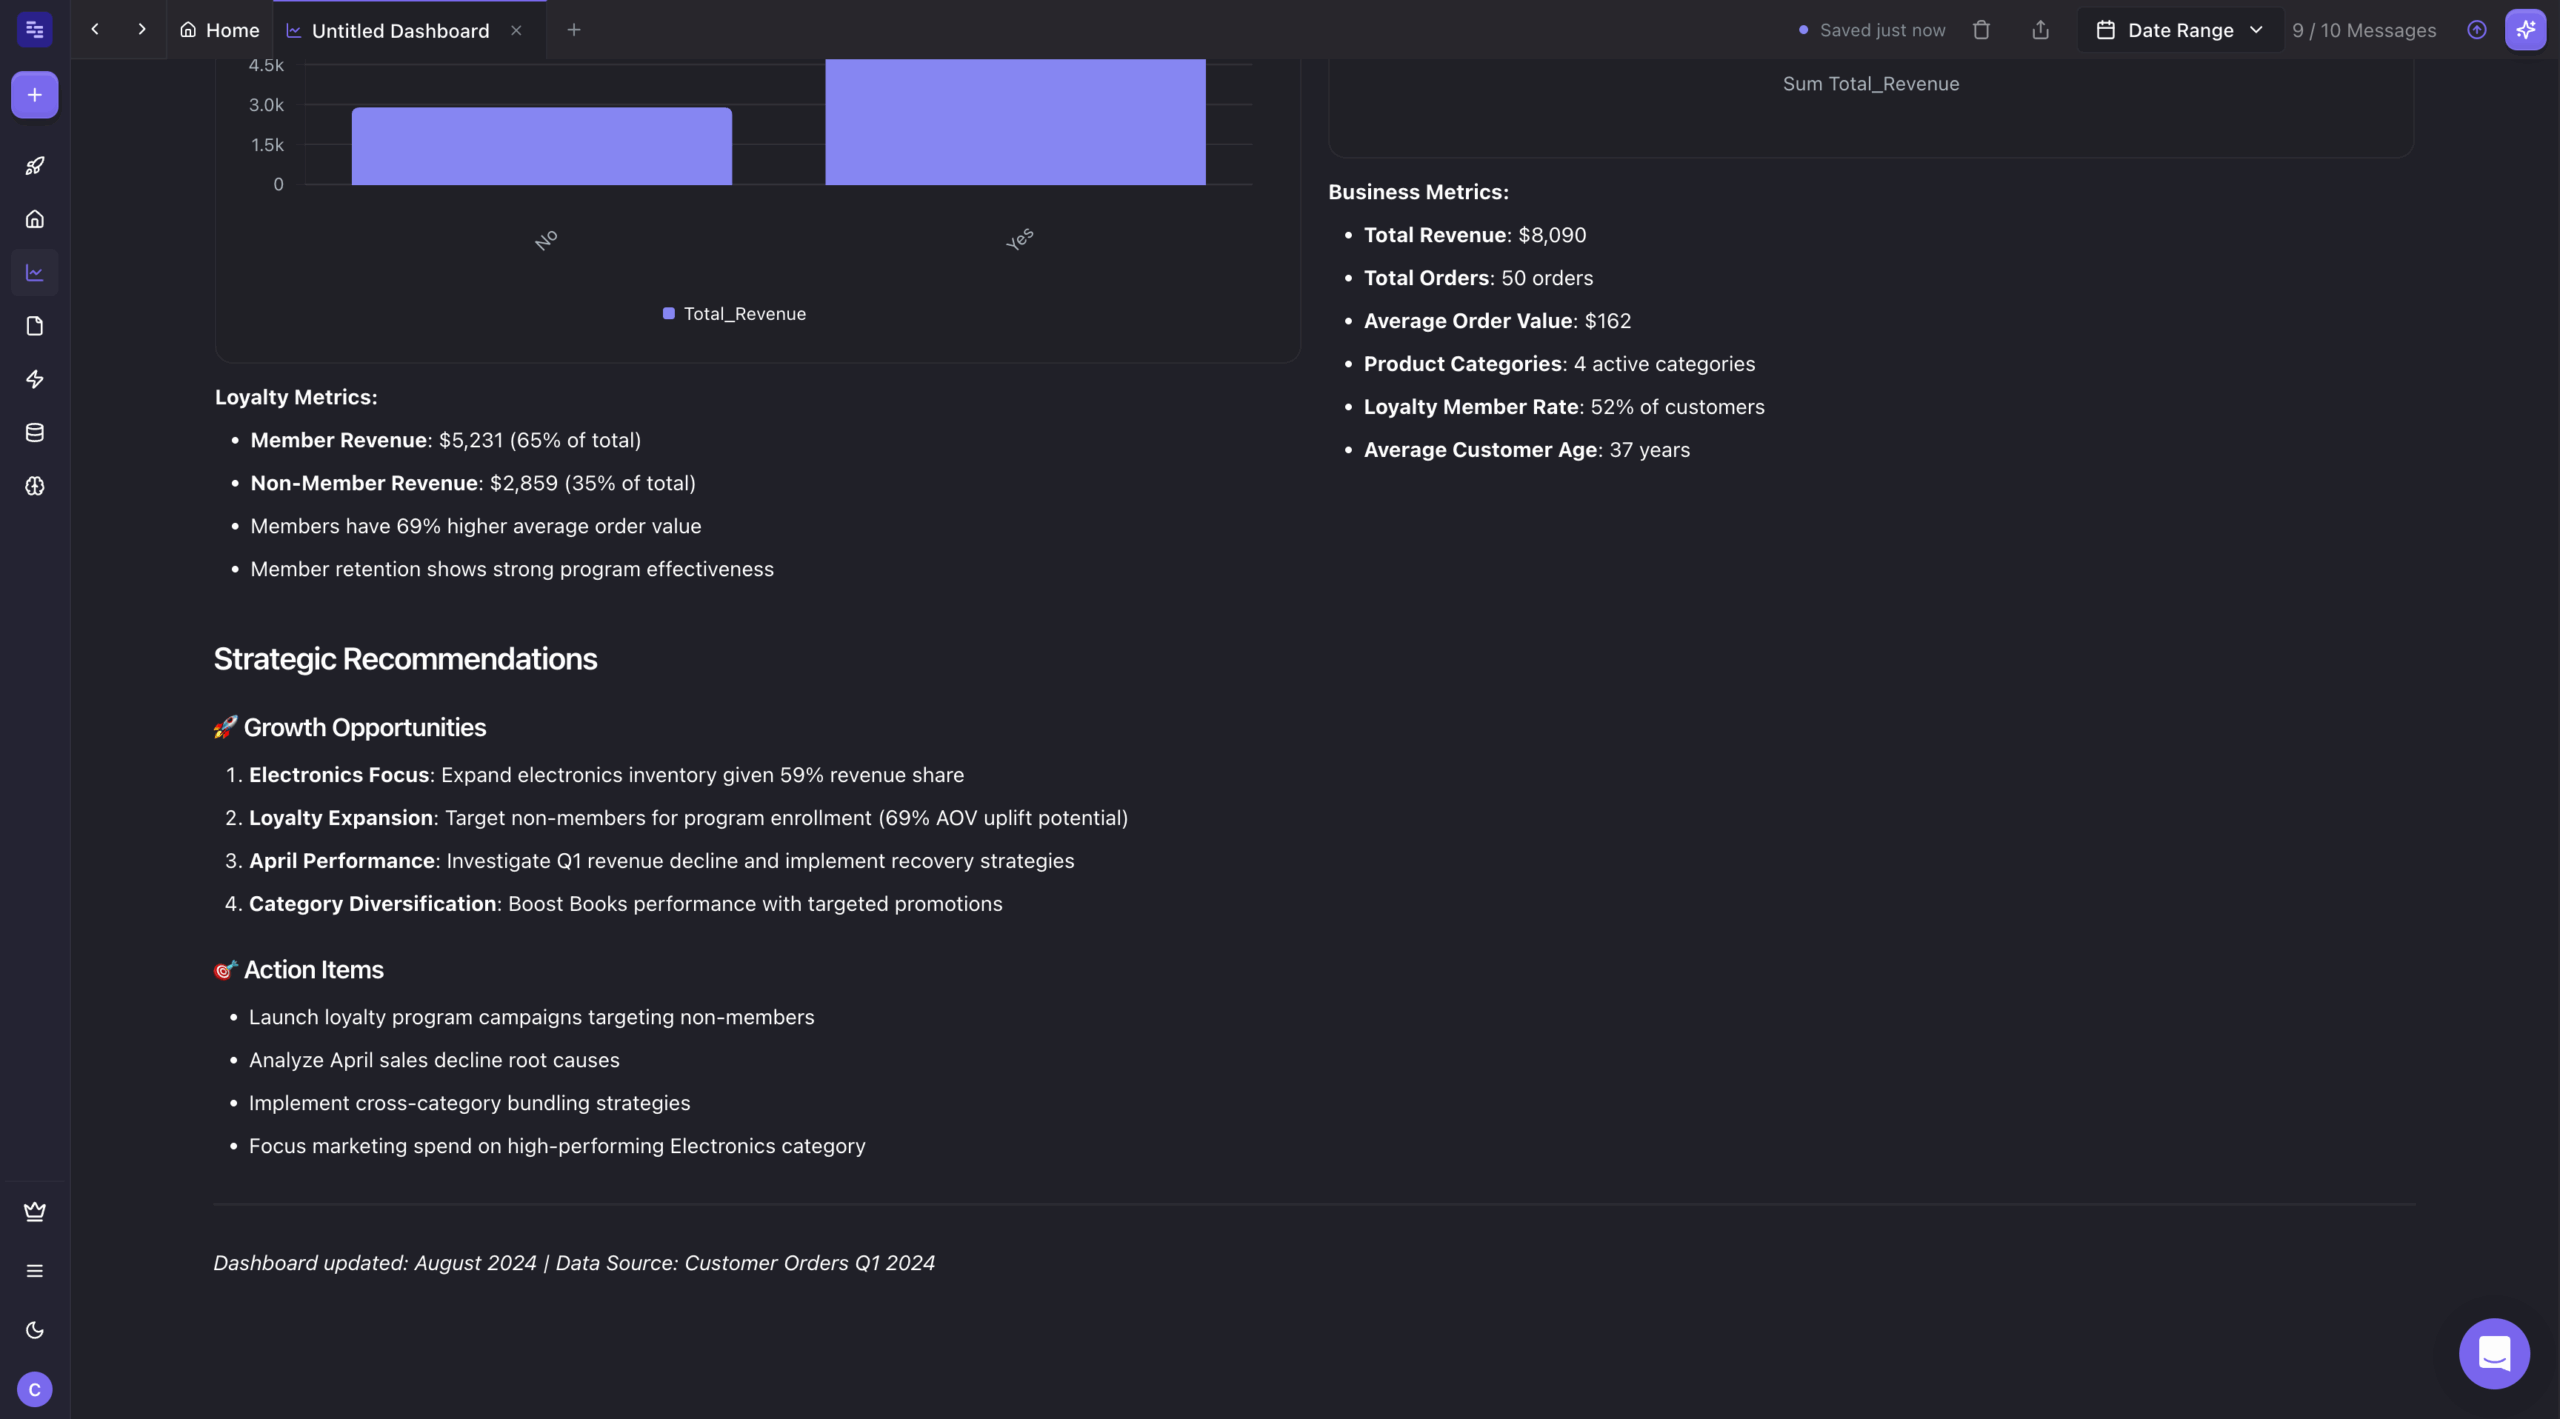
Datapad uses a powerful AI agent to instantly generate dashboards, insights, and strategic recommendations about your dataset. Simply chat with an agent about your dataset and goals, and the tool gets to work making your custom dashboard happen.
At first, I had some trouble getting the dashboard to generate, but I was able to resolve the issue by asking the tool to create the dashboard via chat. Even when I had some issues with that, the tool still answered my questions and provided insights into the data.
If you’re still feeling lost, there are one-click workflows to get you started, and you can always chat with the AI agent to figure out what you need. The neat thing about this tool is that it’s also suited for more advanced users, who can manually edit the dashboard via code. This makes Datapad a great one-two punch for businesses that want to make their data available and usable for both experienced and nontechnical users.
Pros:
- Autonomous AI agent proactively monitors KPIs without manual dashboard checking
- Natural language interface requires zero technical skills
- Auto-learning agent learns about your business over time
Cons:
- Newer platform offers limited third-party integrations compared to more established tools
- Focuses on business KPI monitoring rather than deep statistical analysis
- Customization options for complex statistical methodologies are limited
Plans/Pricing:
- Free plan available
- Basic plan: $20 per month ($16 when billed annually)
G2 rating: 4.2/5
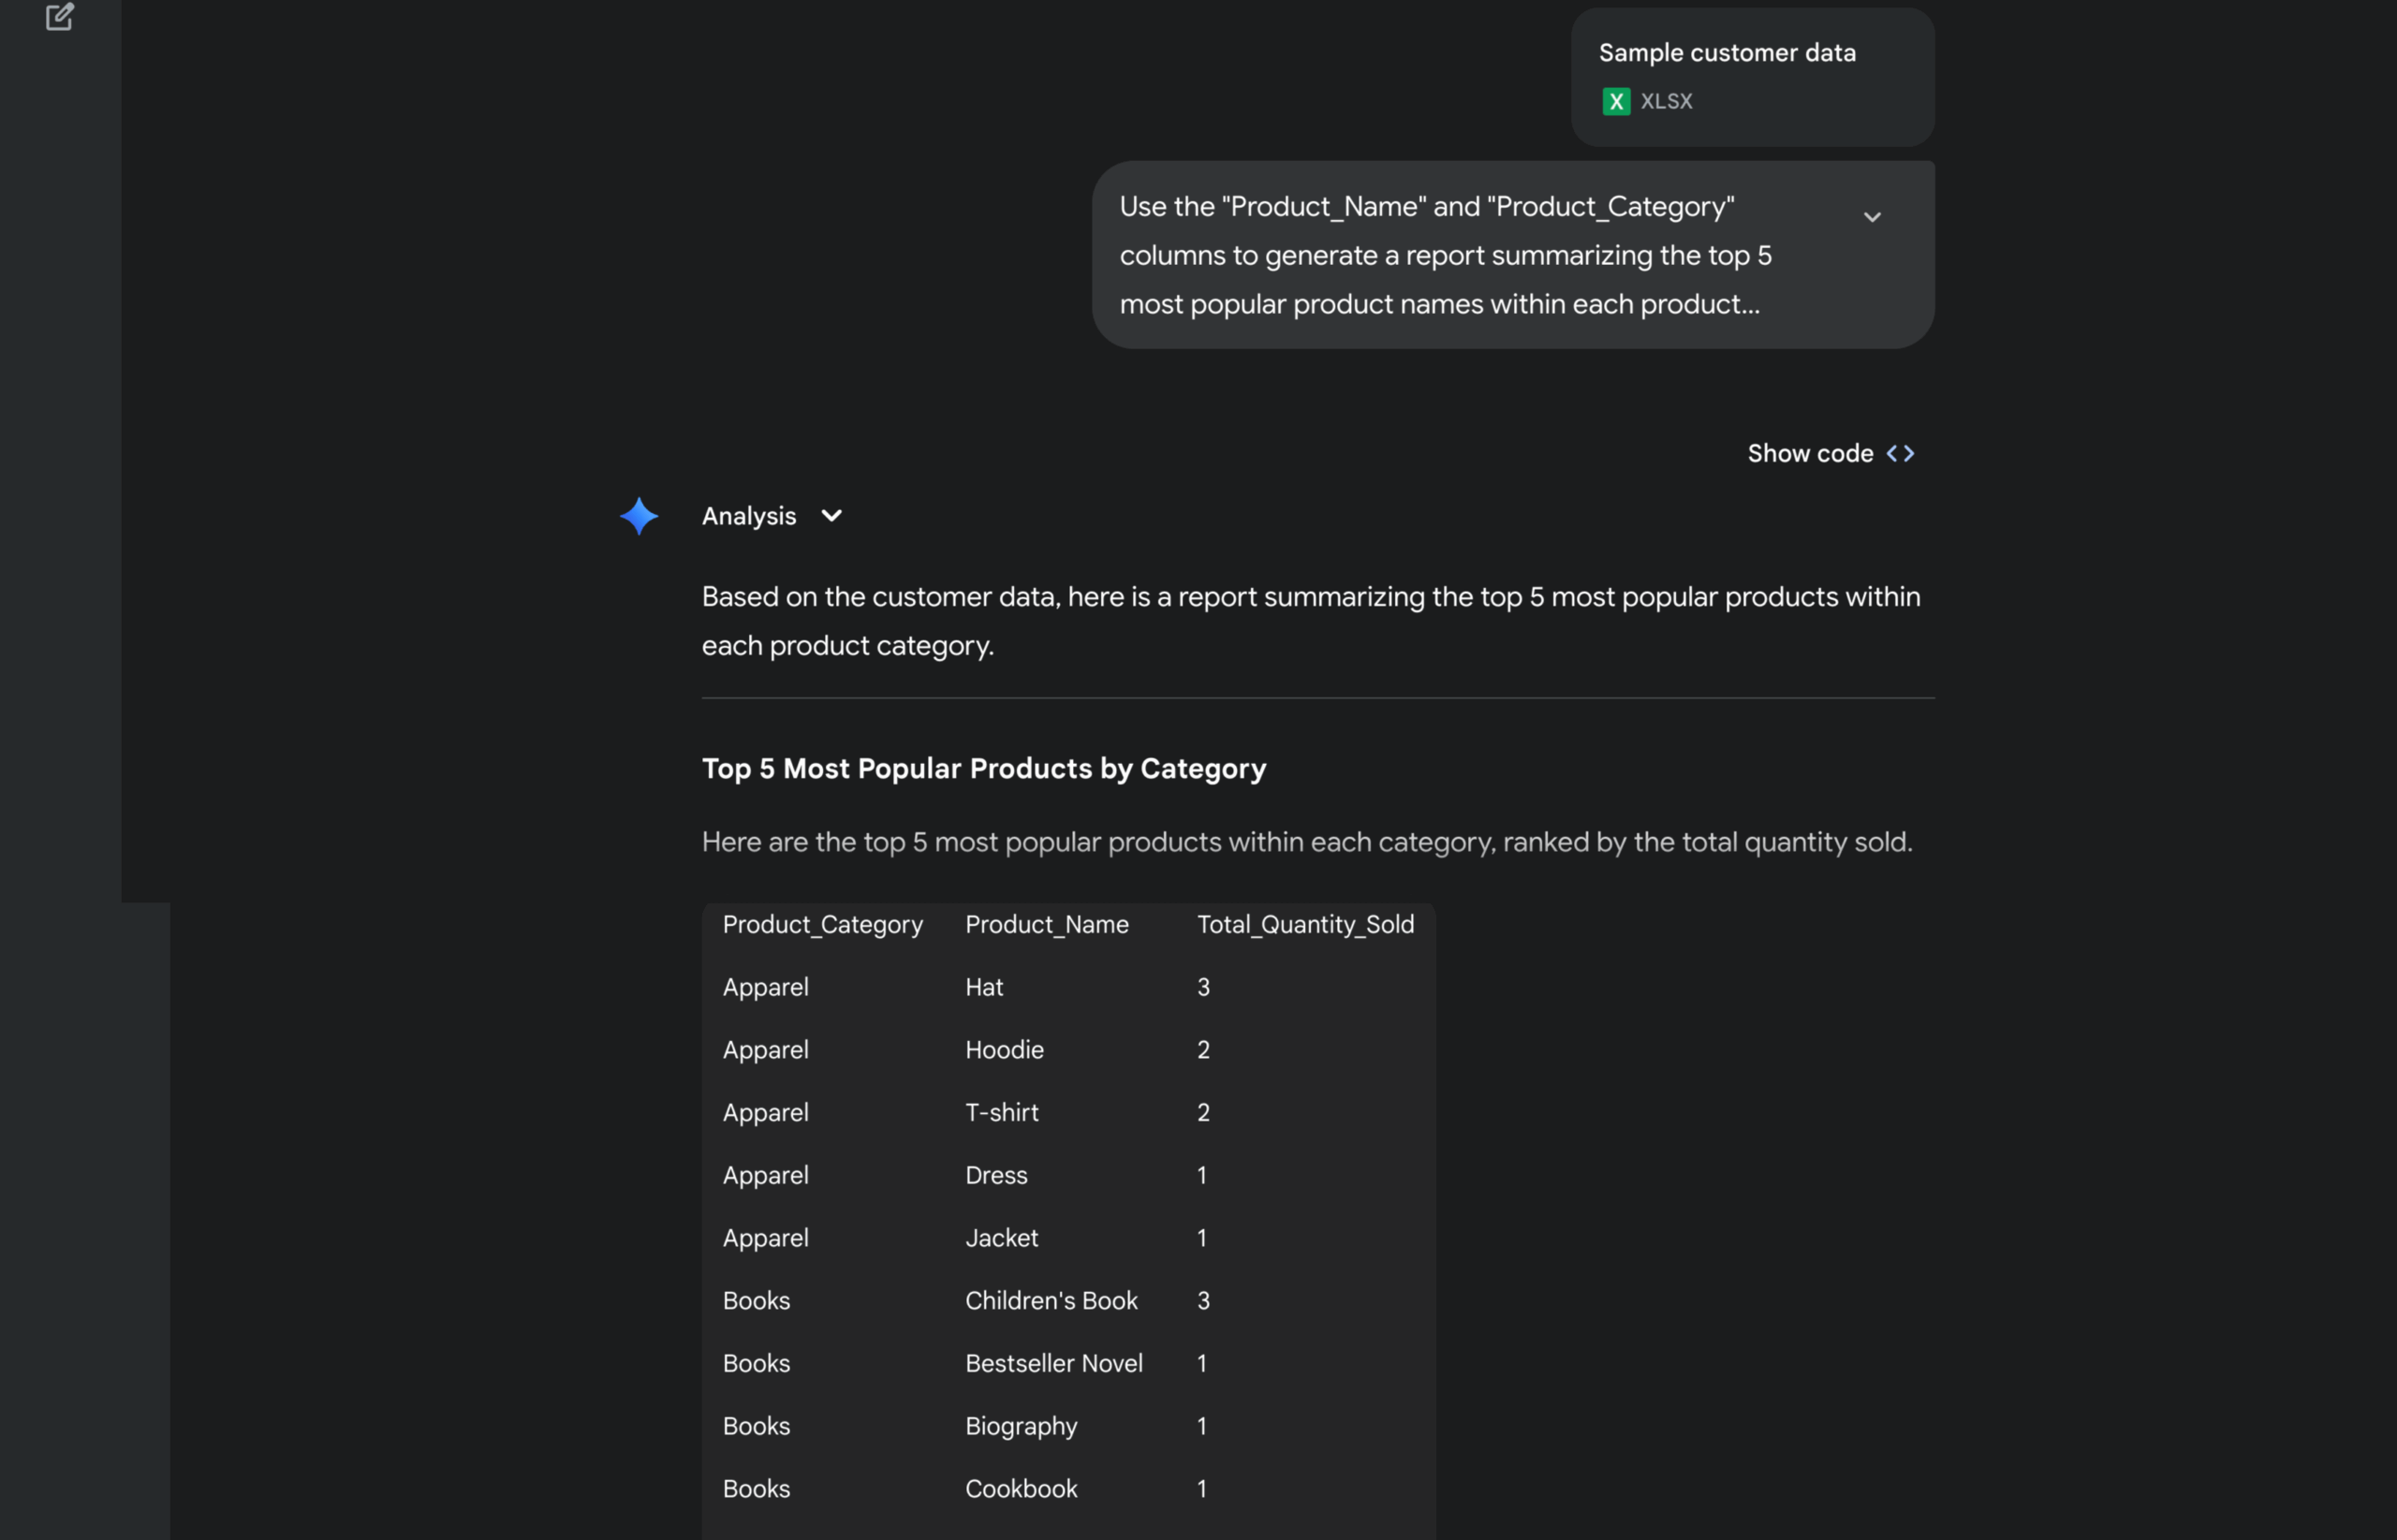
2. Julius AI
Best for: Business teams who need quick insights from Excel files and databases
Developer: Julius AI
You should know: Upload files and ask questions in plain English to get statistical analysis
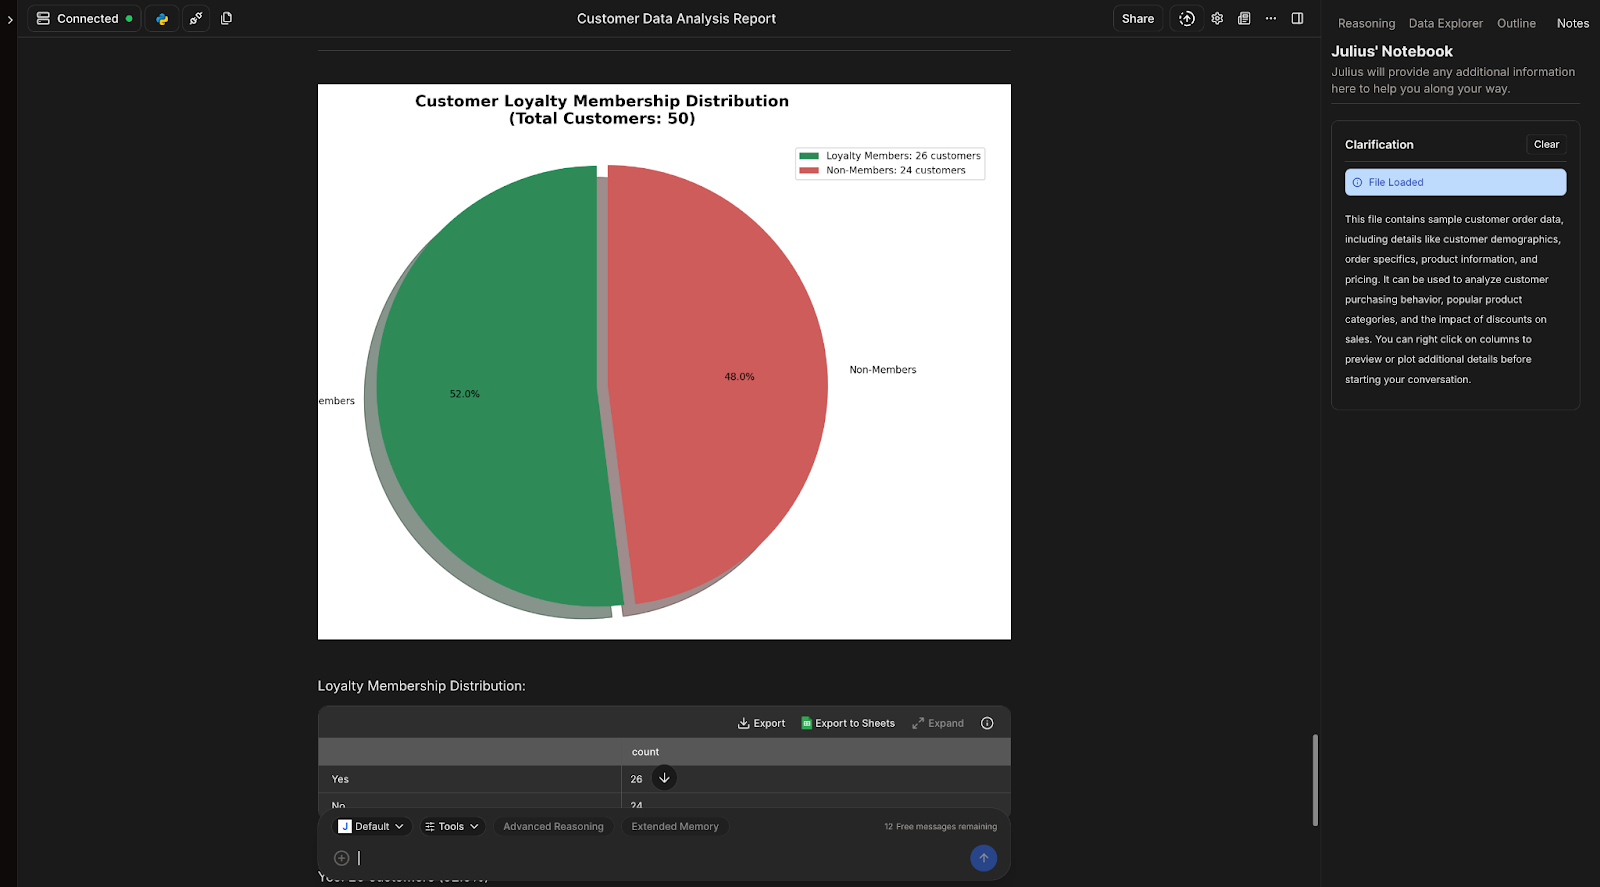
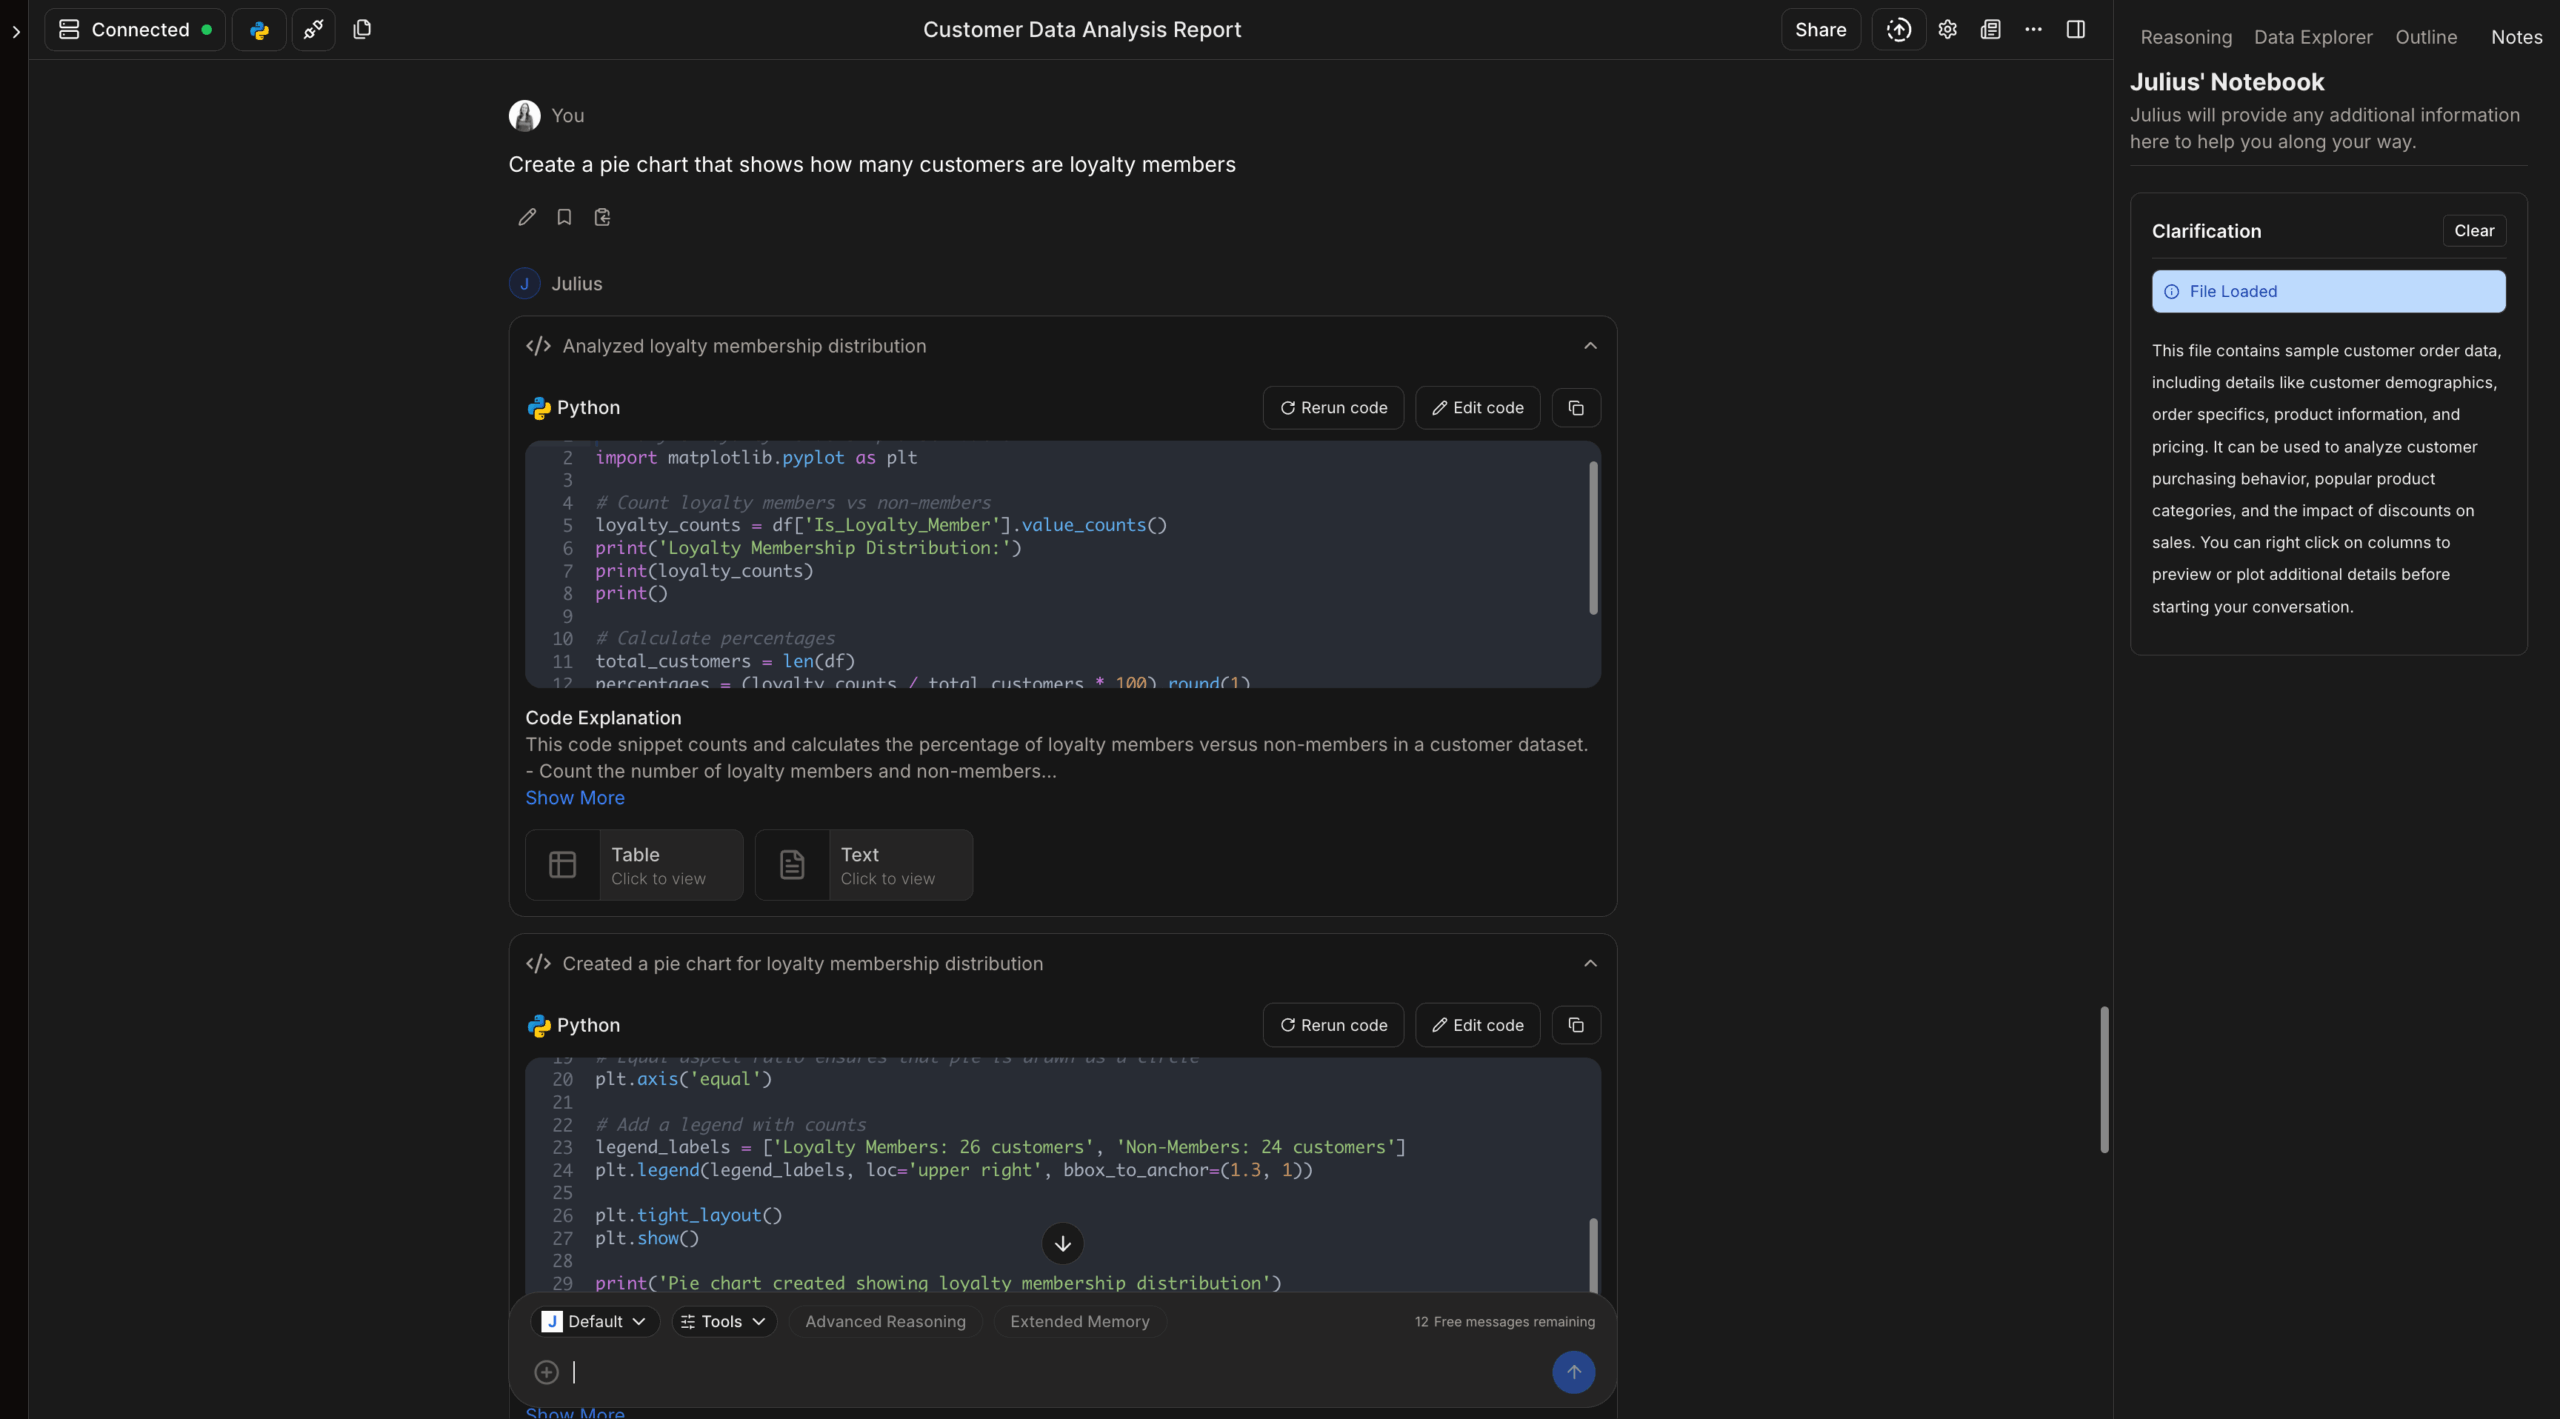
I found that Julius AI struck the perfect balance between providing powerful insights and being very easy to use. I would say it’s the most accessible tool I tested — ideal for users who need statistical insights but lack a technical background. Julius AI also works both as a statistical analysis and an educational tool, making it suitable for students and professionals alike.
The Julius chat interface feels natural. If you have any experience with large language model (LLM) chats, you’ll find this works the same way — and if not, check out our guide to AI models here. Its simple interface is easy to navigate, letting you upload your data and ask away without an overwhelming dashboard or the need for setting up the tool. Julius AI can help you with probability, descriptive statistics, inferential statistics, and even some machine learning basics.
I especially appreciated how the platform automatically selects appropriate statistical methods, generates visualizations, and explains its findings step-by-step in simple terms, which is a lifesaver if you’re not already fluent in statistical jargon.
Pros:
- Requires no statistical or coding knowledge
- Supports common business file formats (Excel, CSV, .gsheet)
- Automatically generates charts based on your questions
- Explains results in clear, simple language
- Lets users adjust statistical models to see how changes affect outcomes and explore simulations
Cons:
- Can be slower with large datasets
- Offers limited control over specific statistical methods used
- Requires an internet connection for all analysis
Plans/Pricing:
- Free plan available
Plus plan: $20 per month ($16 when billed annually)
G2 rating: 4.4/5
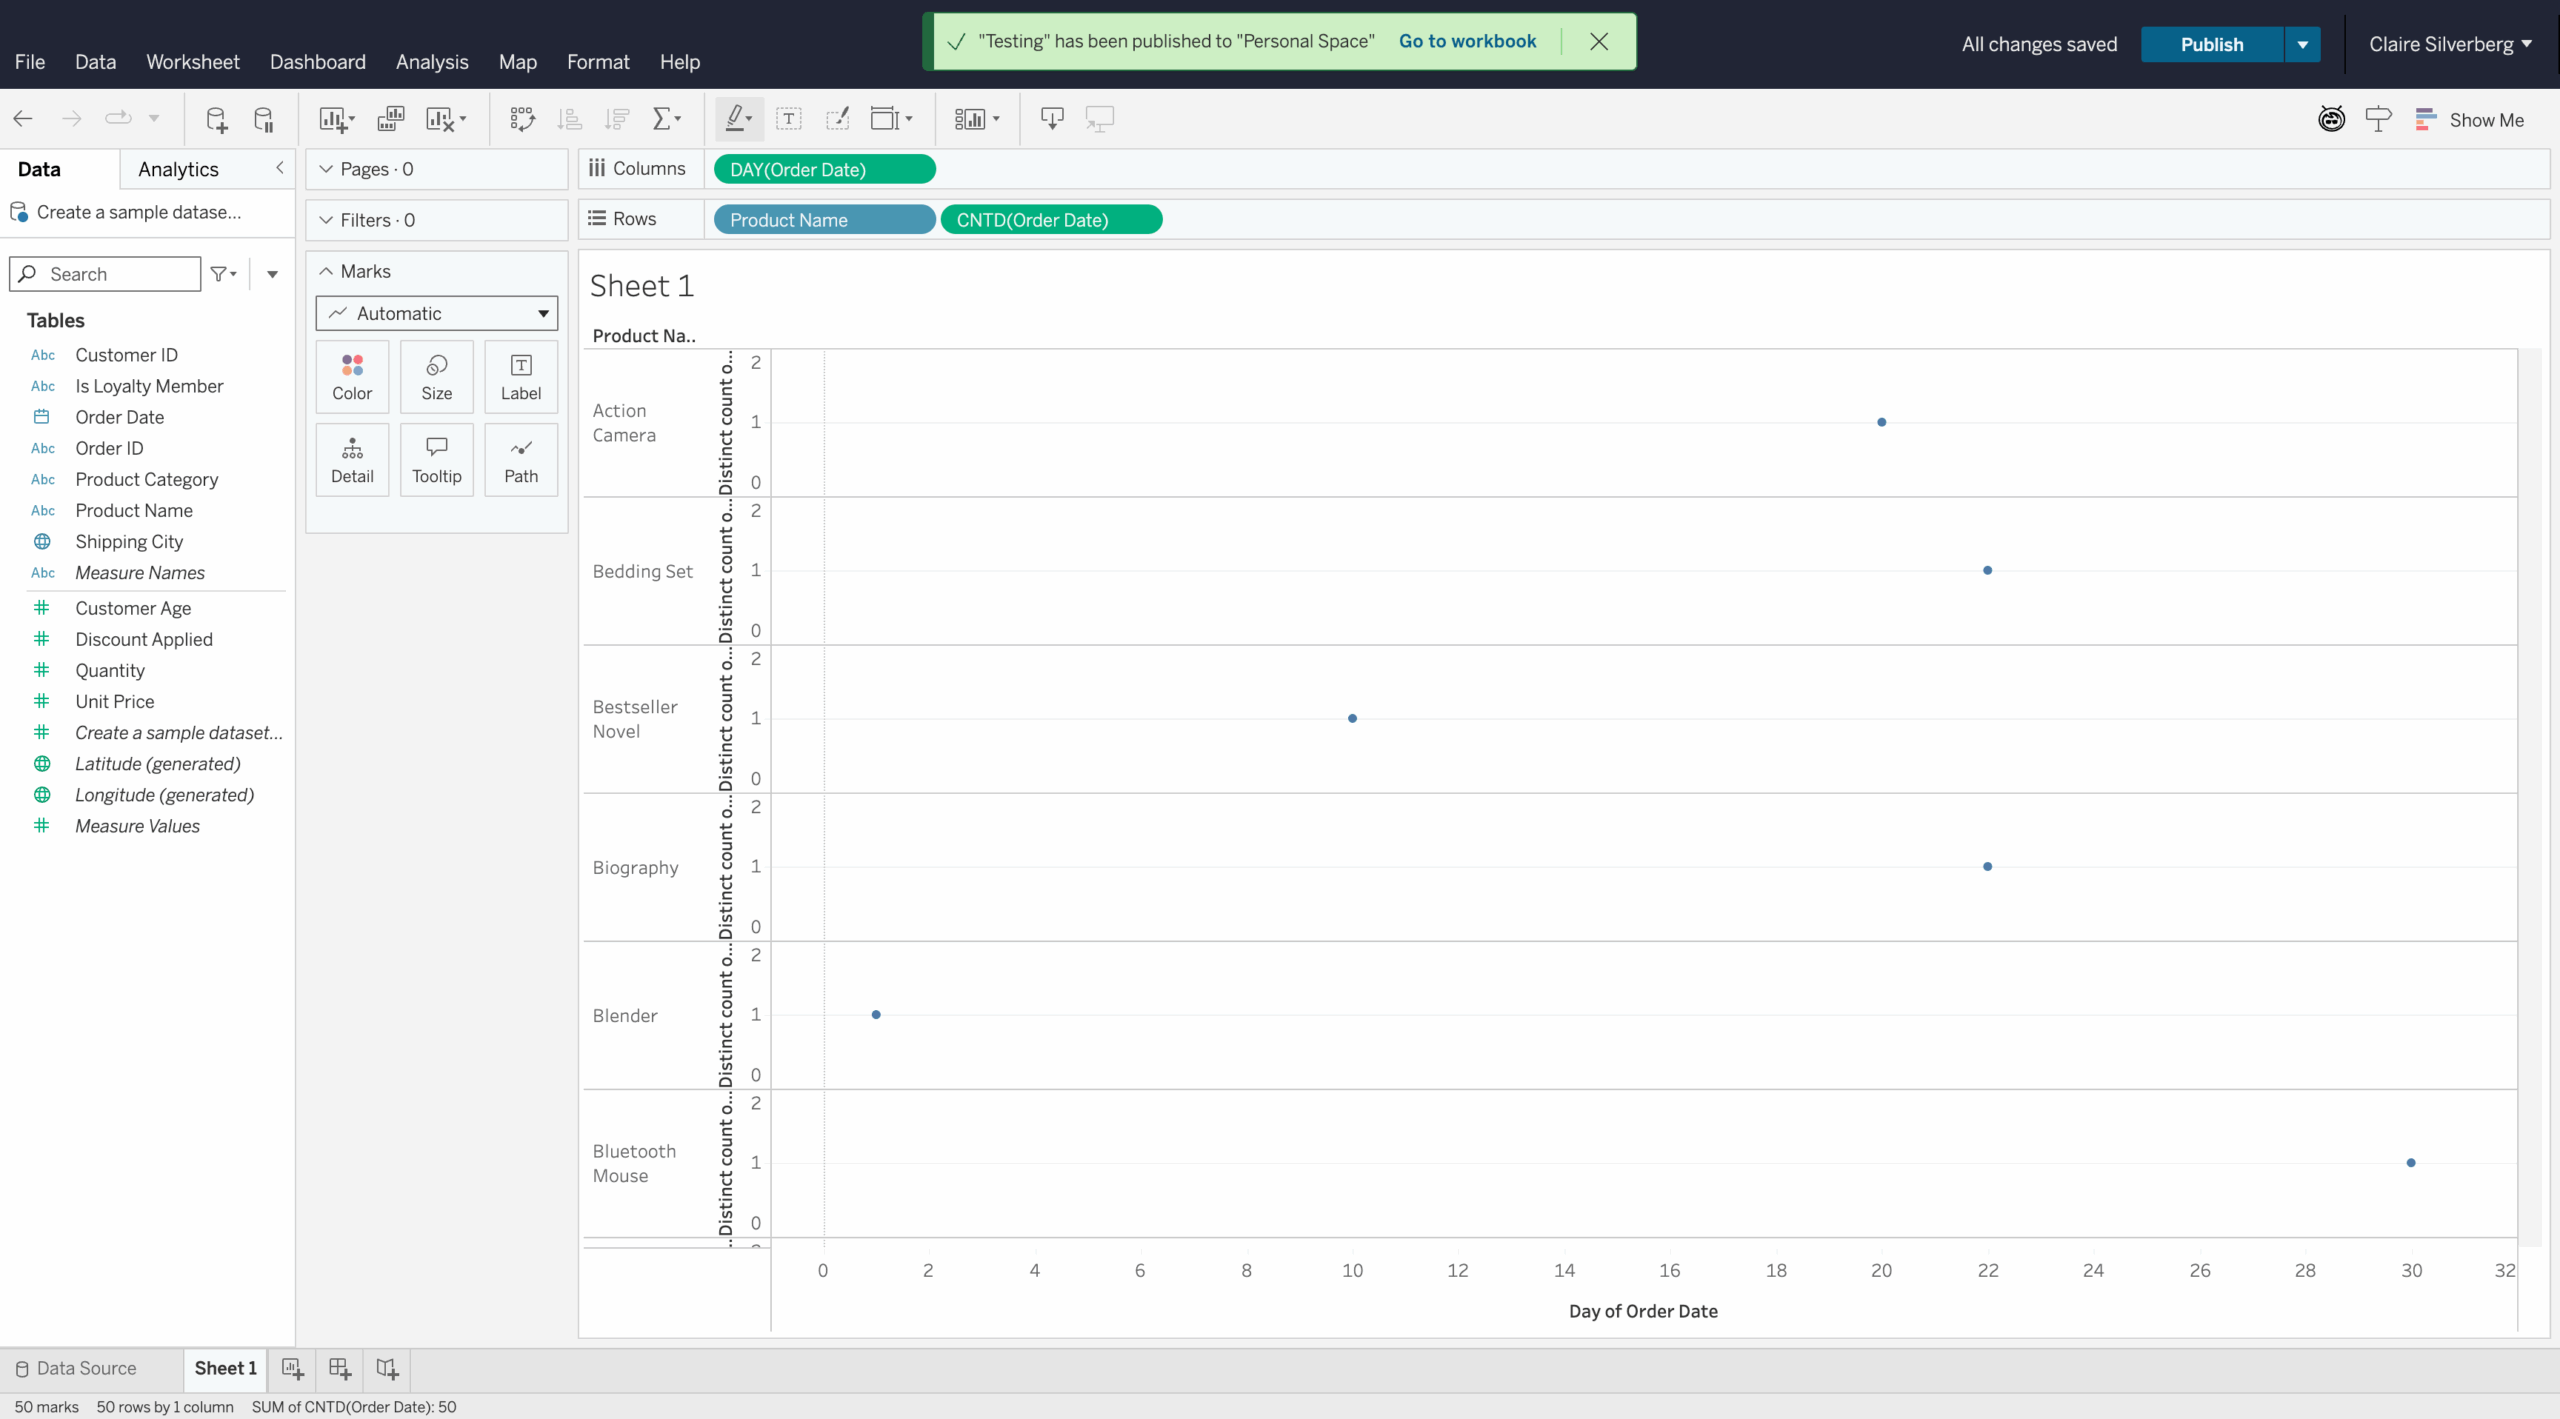
3. Tableau
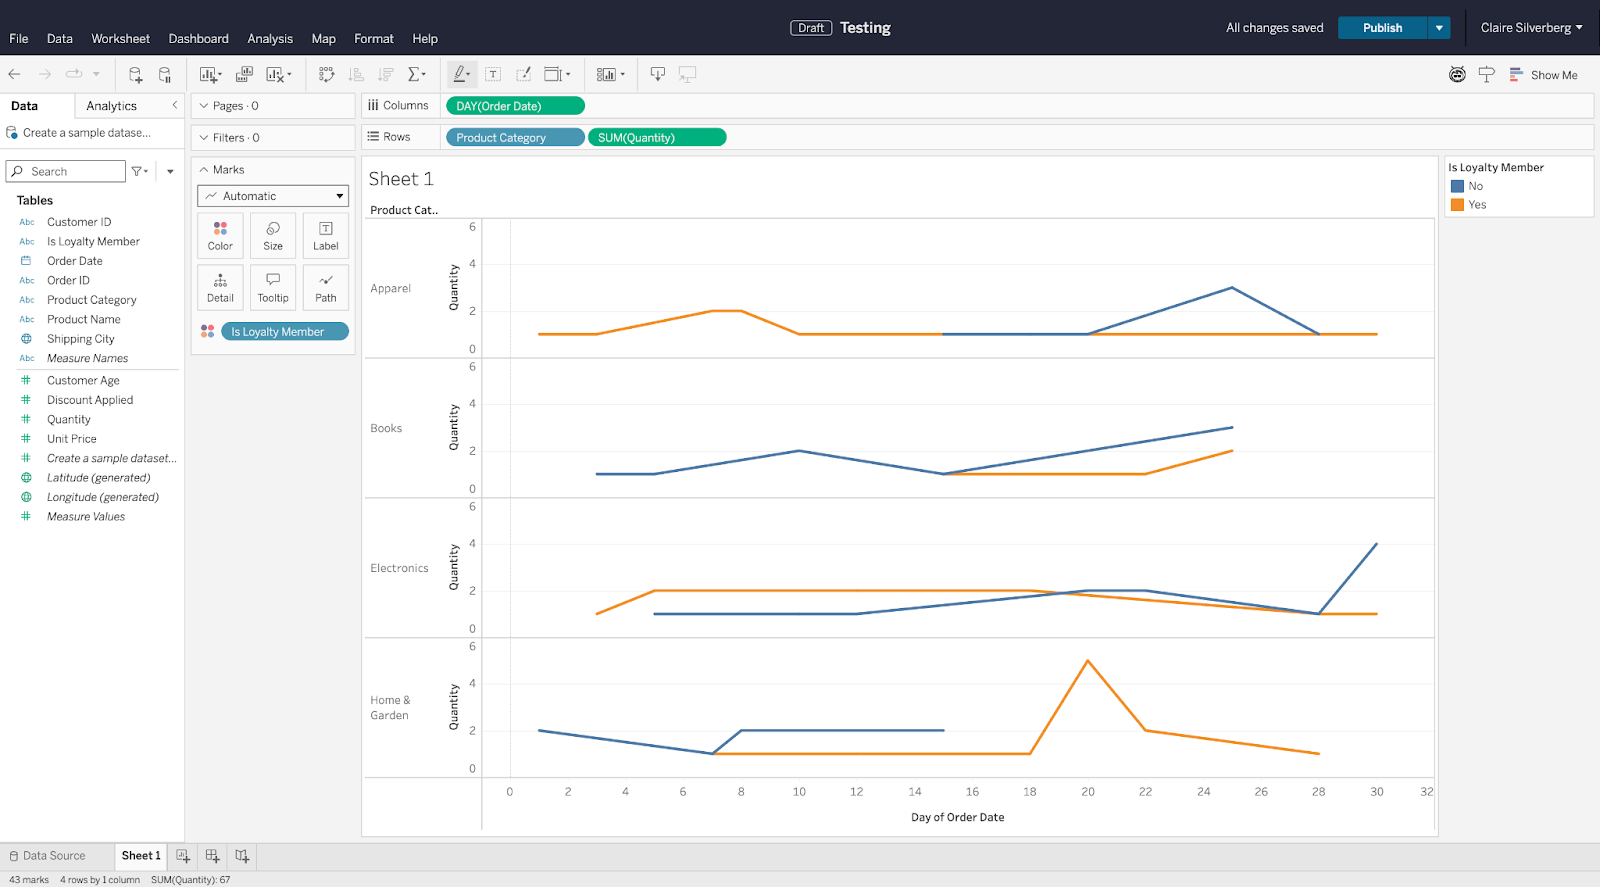
Best for: Organizations needing professional-grade dashboards and visualizations
Developer: Salesforce
You should know: The gold standard for data visualization with AI-powered insights
Tableau is a household name for data analysts. Although I can see why it’s so popular among statisticians, there is a steeper learning curve for new users. The tool helps you, though, with its drag-and-drop dashboard builder and easy connections to Excel, SQL, Google Sheets, and cloud databases that don’t require touching a line of code.
But without statistical analysis experience, I found it a bit overwhelming to sort through all the analysis options, figure out what they mean, and get them to actually work.
Many features allow users with moderate statistical experience to pull more advanced insights. For example, the platform’s AI features — including automated pattern detection and “Explain Data” functionality — help business users understand statistical relationships without deep analytical expertise. However, I couldn’t test this feature without signing up for Tableau+.
For organizations with dedicated analytics teams or those willing to invest in training, Tableau creates publication-ready dashboards with real-time data updates, sure to impress executives and stakeholders. The recently added AI features help surface insights that might be missed in manual analysis, though accessing these features requires understanding Tableau’s rather complex interface.
Pros:
- Offers industry-leading visualization capabilities
- Connects to virtually any business data source
- AI-powered insights help identify hidden patterns
- Creates professional dashboards suitable for executive presentations
- Tableau Public makes it easy to share insights
- Provides easy collaboration features for enterprise teams
Cons:
- High costs
- Requires significant training investment
- Can overcomplicate simple analysis tasks
Plans/Pricing: Contact for pricing
G2 rating: 4.4/5
4. Desmos
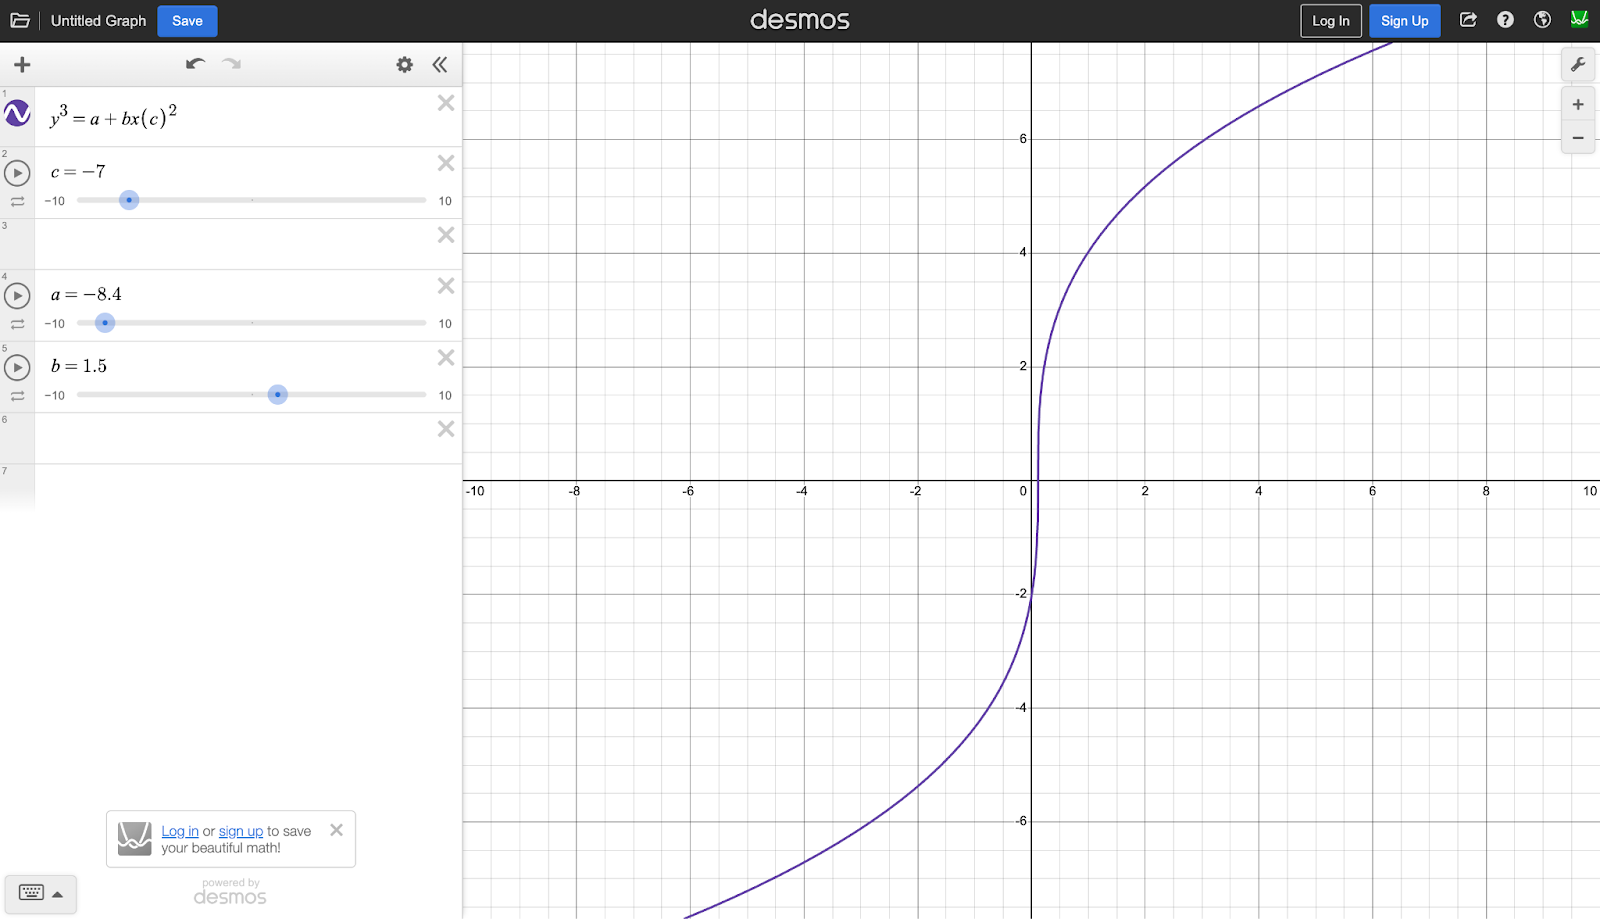
Best for: Interactive data visualizations and presentations
Developer: Desmos Studio
You should know: Free online statistical calculator with advanced features
Desmos is very different from the other statistical tools I tested, but it’s earned a spot on this list as an invaluable tool for teachers and students. Desmos functions like a complex calculator, supporting probability distributions, regression models, scatter plots, and more. It’s free and available on any device with access to the internet or the Desmos app.
Graphing calculators can be very expensive, so this tool is a big win for accessibility. It isn’t right for everyone, though. Business users won’t be able to upload datasets or pull key insights, but teachers and students can use it for statistical exploration.
I don’t have much use for Desmos myself, but I was able to enter an equation and input sample values, seeing how they’d affect my graph with real-time plotting. As a visual learner, I wish this tool had been around to help me out in past statistics courses.
Pros:
- Completely free and requires no registration
- Provides dynamic statistical visualizations
- Works on any device through web browser
- Creates automatic visualizations from raw data table input
- Educational tutorials improve accessibility for self-taught statisticians and students
Cons:
- Only works as a calculator
- Cannot analyze large datasets
- Cannot import or analyze business datasets
- Cannot perform complex statistical modeling
- Requires manual data entry for custom analysis
Plans/Pricing: Free
G2 rating: 4.4/5
5. Dataiku
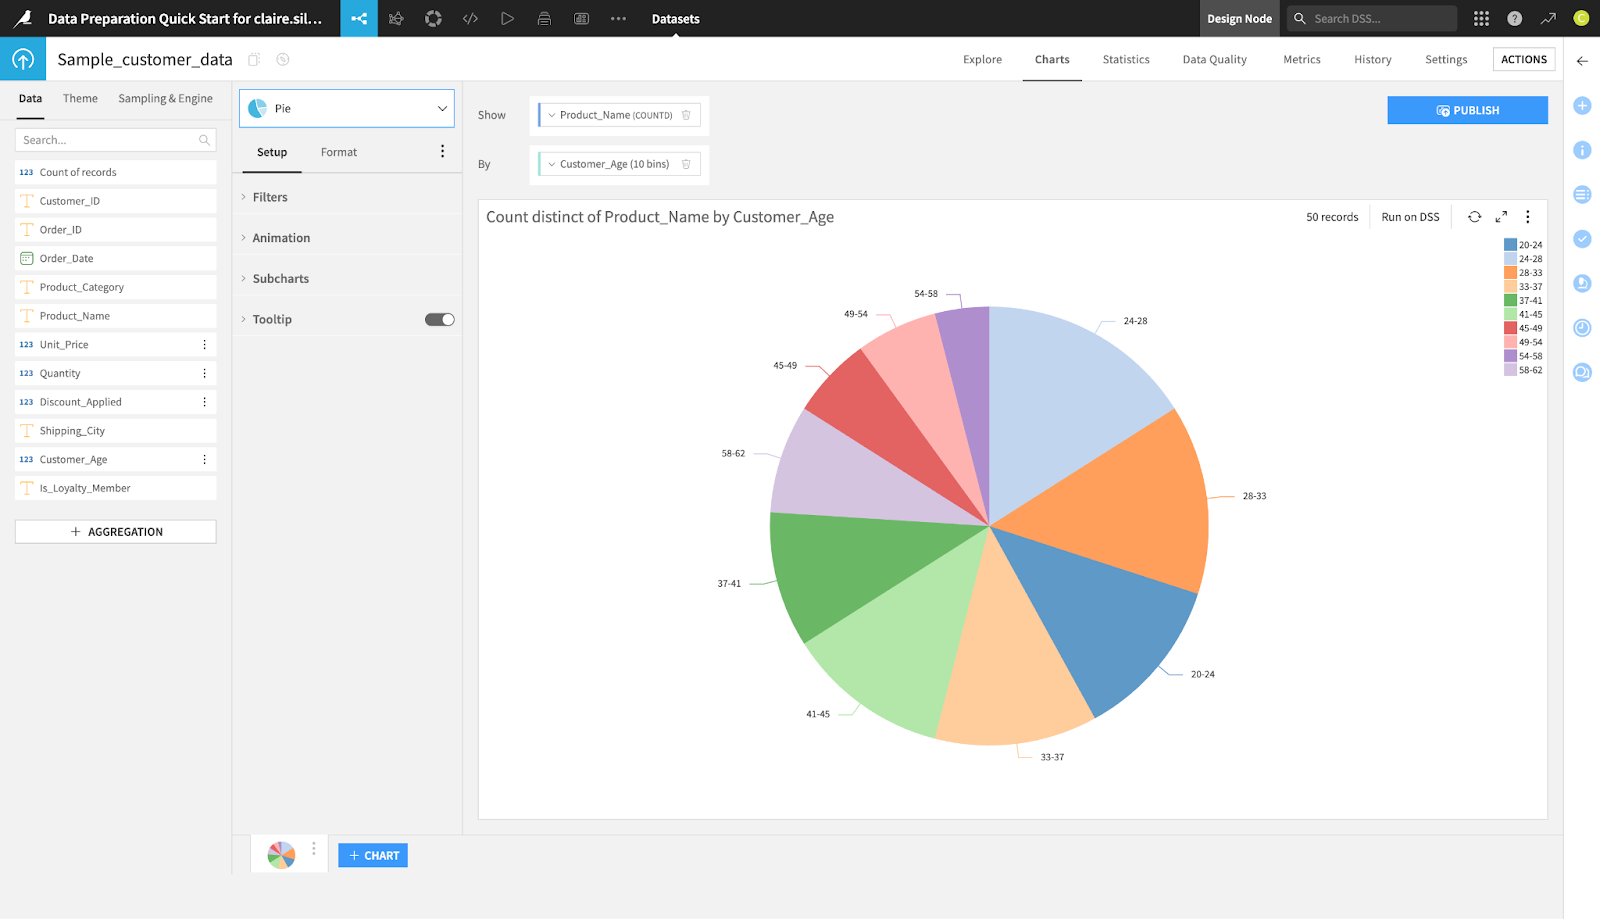
Best for: Enterprise teams building end-to-end data science and AI workflows
Developer: Dataiku
You should know: Collaborative data science platform for teams who want to build data-based products
I found Dataiku to be the most beginner-friendly enterprise AI statistics tool and the best AI for data science. The interface is similar to Tableau, but it was easier to drag and drop metrics and create impactful data visualizations in Dataiku. There’s also a built-in tutorial when you begin, helping new users like me get their bearings while exploring core features like data visualization, data preparation, and machine learning.
The more advanced features, like building workflows, would likely require some help from experienced statisticians or data analysts. But I was able to do some simple data cleaning easily, such as separating commerce orders from a sample dataset by billing city.
With time and training, I could see this tool being a great way to build more data experience across technical tools. However, that would require a data team and a subscription to Dataiku. These factors put this tool out of reach for the majority of small or medium-sized businesses.
Pros:
- Covers the entire data science lifecycle
- Visual interface makes complex statistical workflows more accessible
- Provides robust multiuser collaboration support on dashboards for enterprise teams
- Supports both no-code and advanced programming approaches
- Offers strong integration support for different types of data inputs and formats
Cons:
- Setup is complex, with a significant learning curve for advanced features
- Platform is overkill for simple statistical analysis needs
- Requires dedicated data science team to justify the investment
Plans/Pricing:
- Free plan available
- Contact for pricing details
G2 rating: 4.4/5
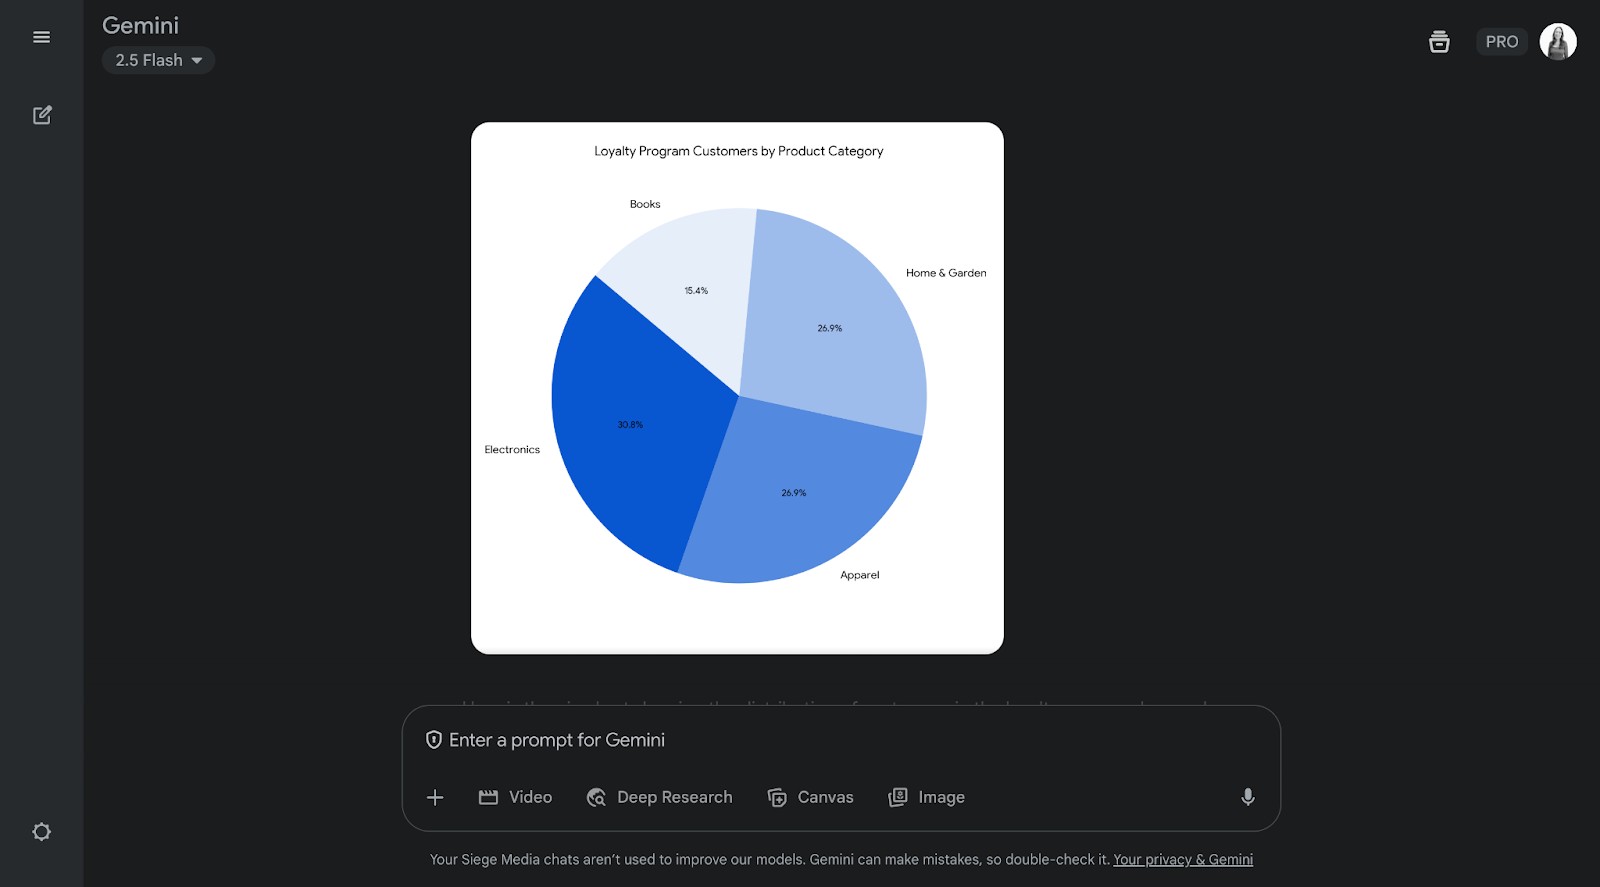
6. Gemini
Best for: Teams already using Google Workspace for business operations
Developer: Google
You should know: Integrated AI analysis across Google Docs, Sheets, and Drive
Gemini‘s integration with Google Workspace harnesses the power of Google’s language model for dialogue applications, or LaMDA, to create seamless workflows for teams already using these tools daily. During my testing, I could analyze spreadsheet data, generate insights in Google Docs, and create presentations with statistical findings, all through natural language commands.
The multimodal capabilities impressed me most. I saved time dropping in images and data tables — with other tools, I probably would’ve had to find a way to translate that data to text first. For marketing teams managing campaigns across different content types, this unified approach eliminates the friction of switching between specialized tools, making Gemini the ultimate machine learning (ML) helper.
Pros:
- Integrates seamlessly with Google Workspace tools
- Provides multimodal analysis of text, images, and data
- Natural language interface requires no training
- Automatically generates data summaries, charts, and formulas
- Can help generate, debug, optimize, and edit code
Cons:
- Privacy concerns for sensitive business data
- Limited advanced statistical methodologies
- Full functionality only available with Google ecosystem adoption
Plans/Pricing:
- Google AI Pro: $20 per month
- Google AI Ultra: $249.99 per month
G2 rating: 4.4/5
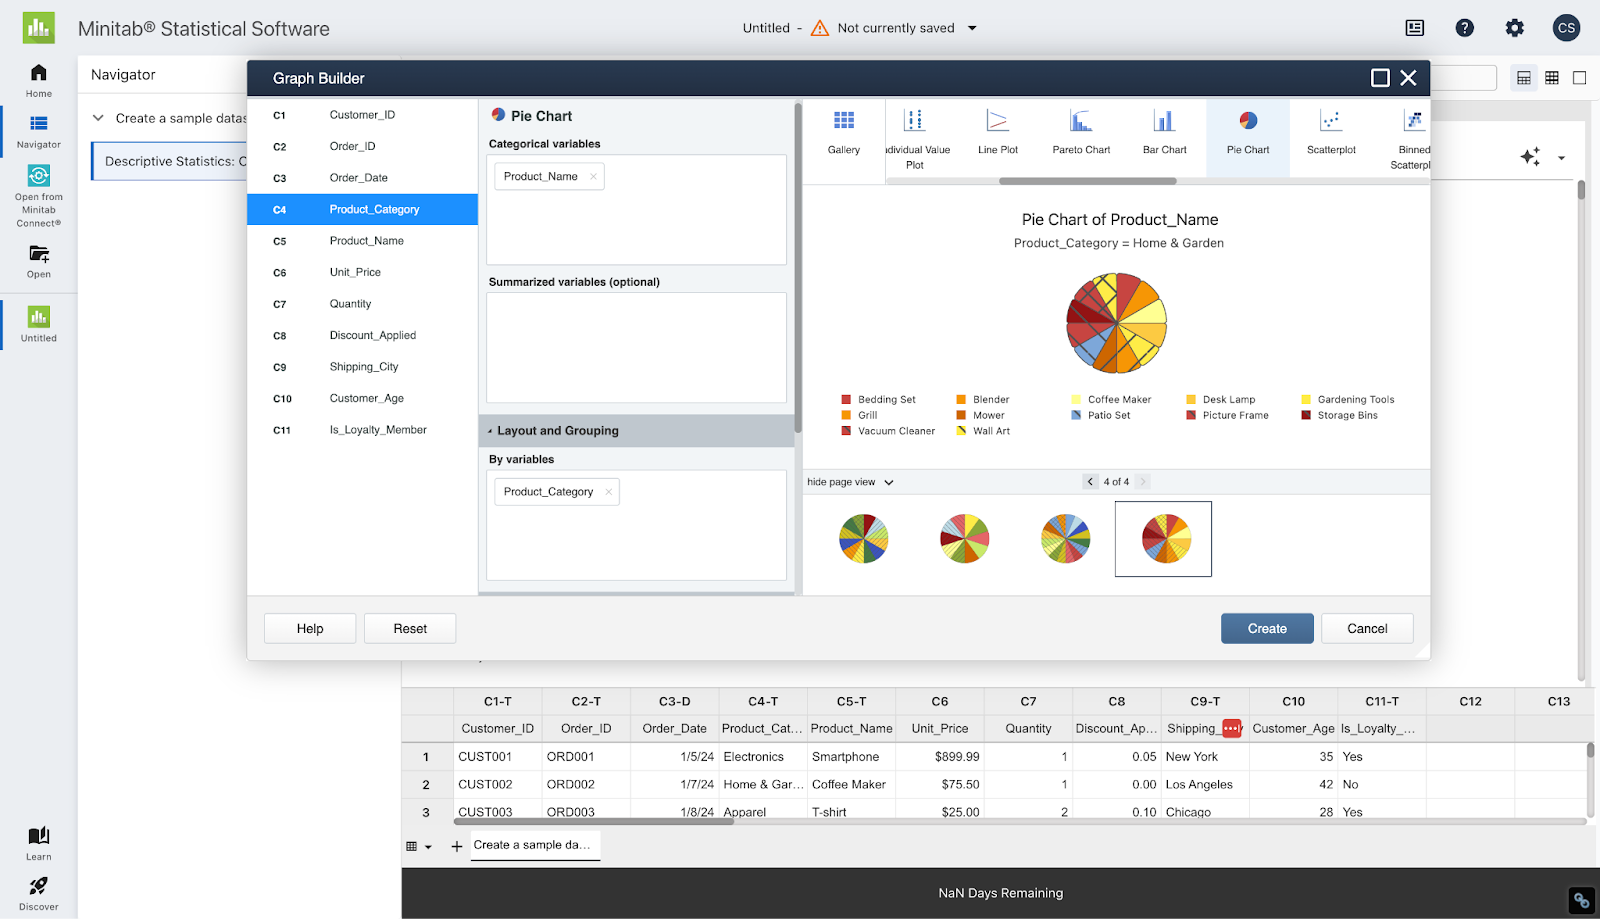
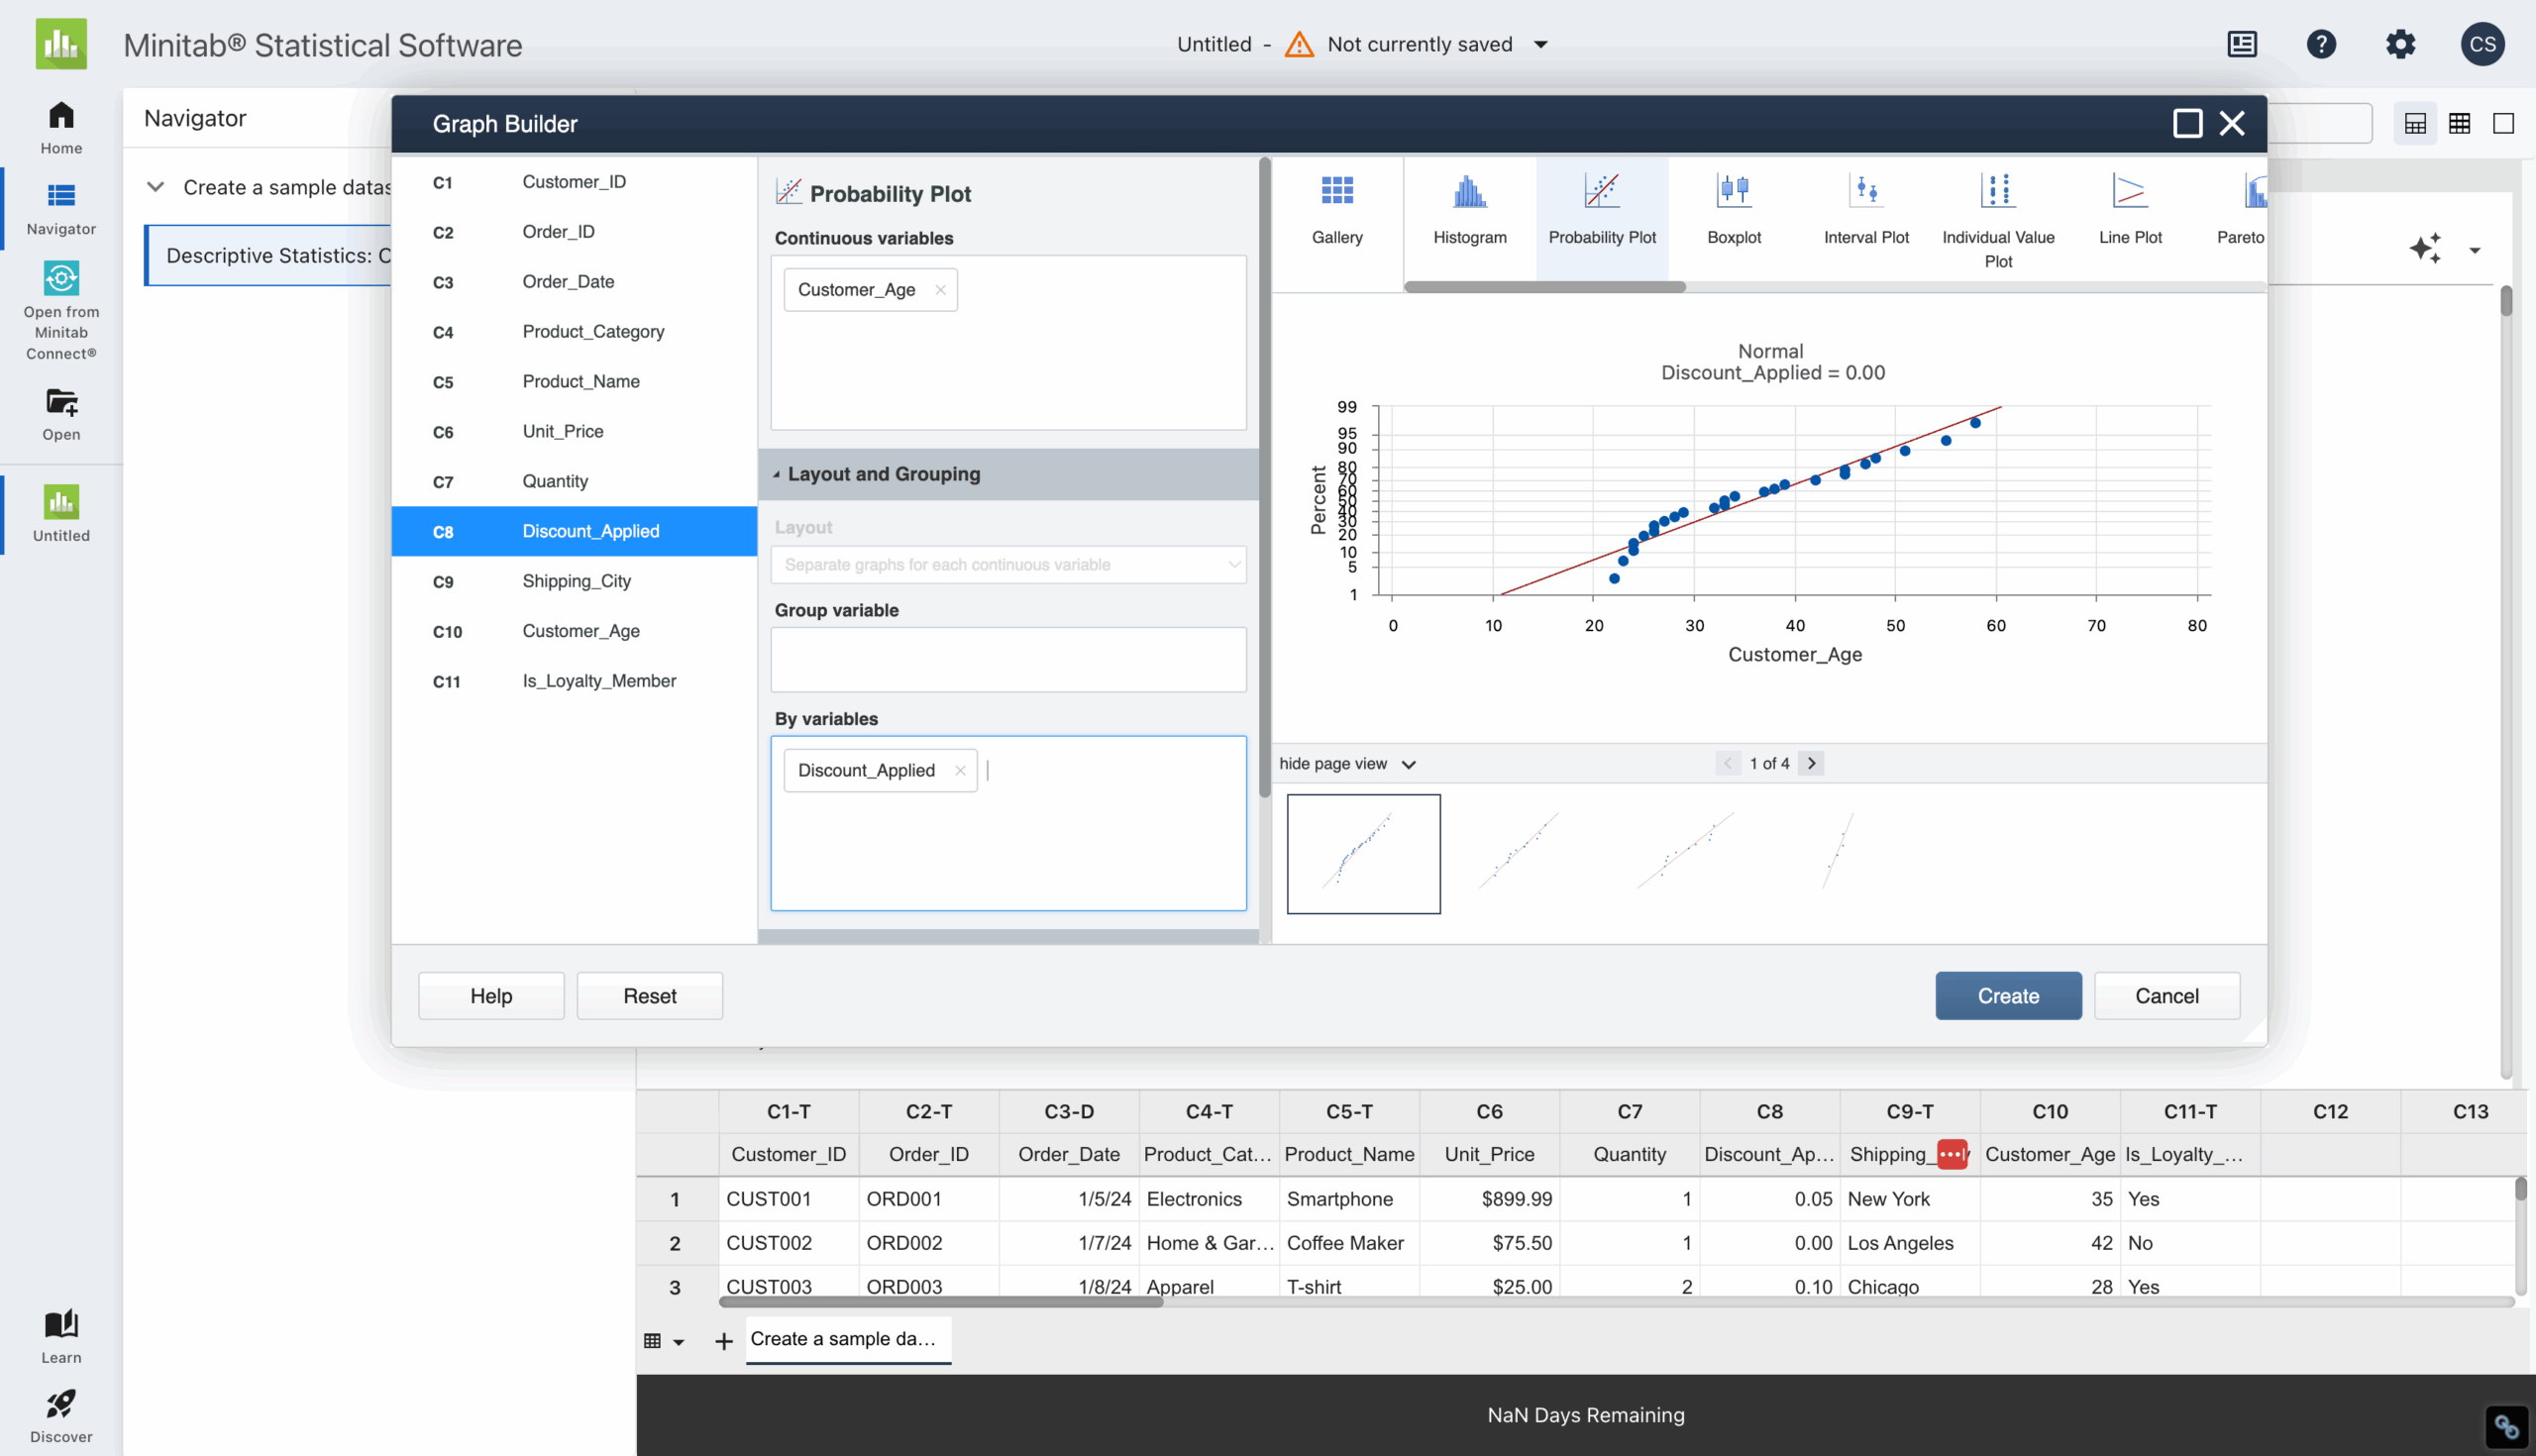
7. Minitab
Best for: Professional statistical analysis and quality control in manufacturing and research
Developer: Minitab LLC
You should know: Comprehensive suite of statistical, data analysis, and process improvement tools for trend analysis and problem-solving
It’s been a while since I worked with SPSS (Statistical Package for the Social Sciences) in school, but if you’re familiar with that program, then Minitab will feel quite familiar. And if that comparison feels scary, don’t worry — Minitab is less finicky and works via the web (although there is also a downloadable option), so you don’t need to worry about a crash ruining your project.
Minitab also feels much more modern thanks to its use of AI. I’m not very confident in my data analysis capabilities, but this tool gave me explanations of my dataset and relevant insights to guide me through its statistical analysis. Minitab provides a life raft when you’re feeling lost in a sea of numbers.
Pros:
- Industry-standard statistical testing capabilities
- Extensive quality control and process improvement tools
- Detailed reporting suitable for academic and regulatory requirements
- Strong support for traditional statistical methodologies
Cons:
- Steep learning curve focused on traditional statistical methods
- High cost and complex licensing structure
- Significant statistical knowledge required to use effectively
- Outdated interface compared to modern AI-powered tools
- Limited data analysis automation compared to newer platforms
Plans/Pricing:
- Free trial available
- Subscriptions start at $1,851 per user per year
G2 rating: 4.5/5
8. ChatGPT
Best for: Quick statistical analysis and learning about statistical concepts
Developer: OpenAI
You should know: Advanced Data Analysis feature enables sophisticated statistical computing
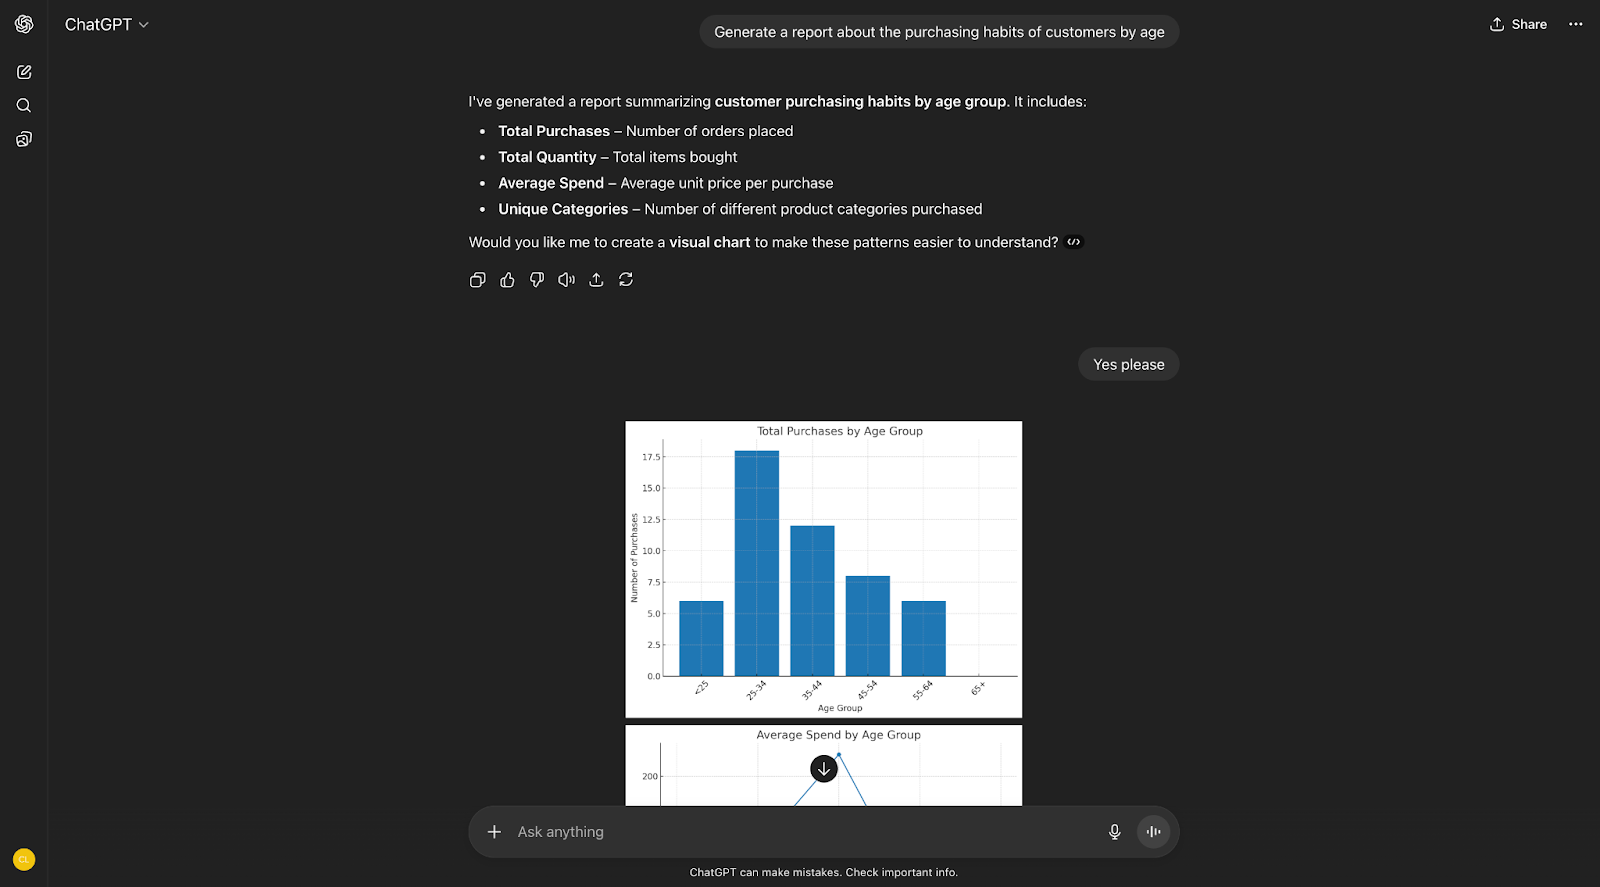
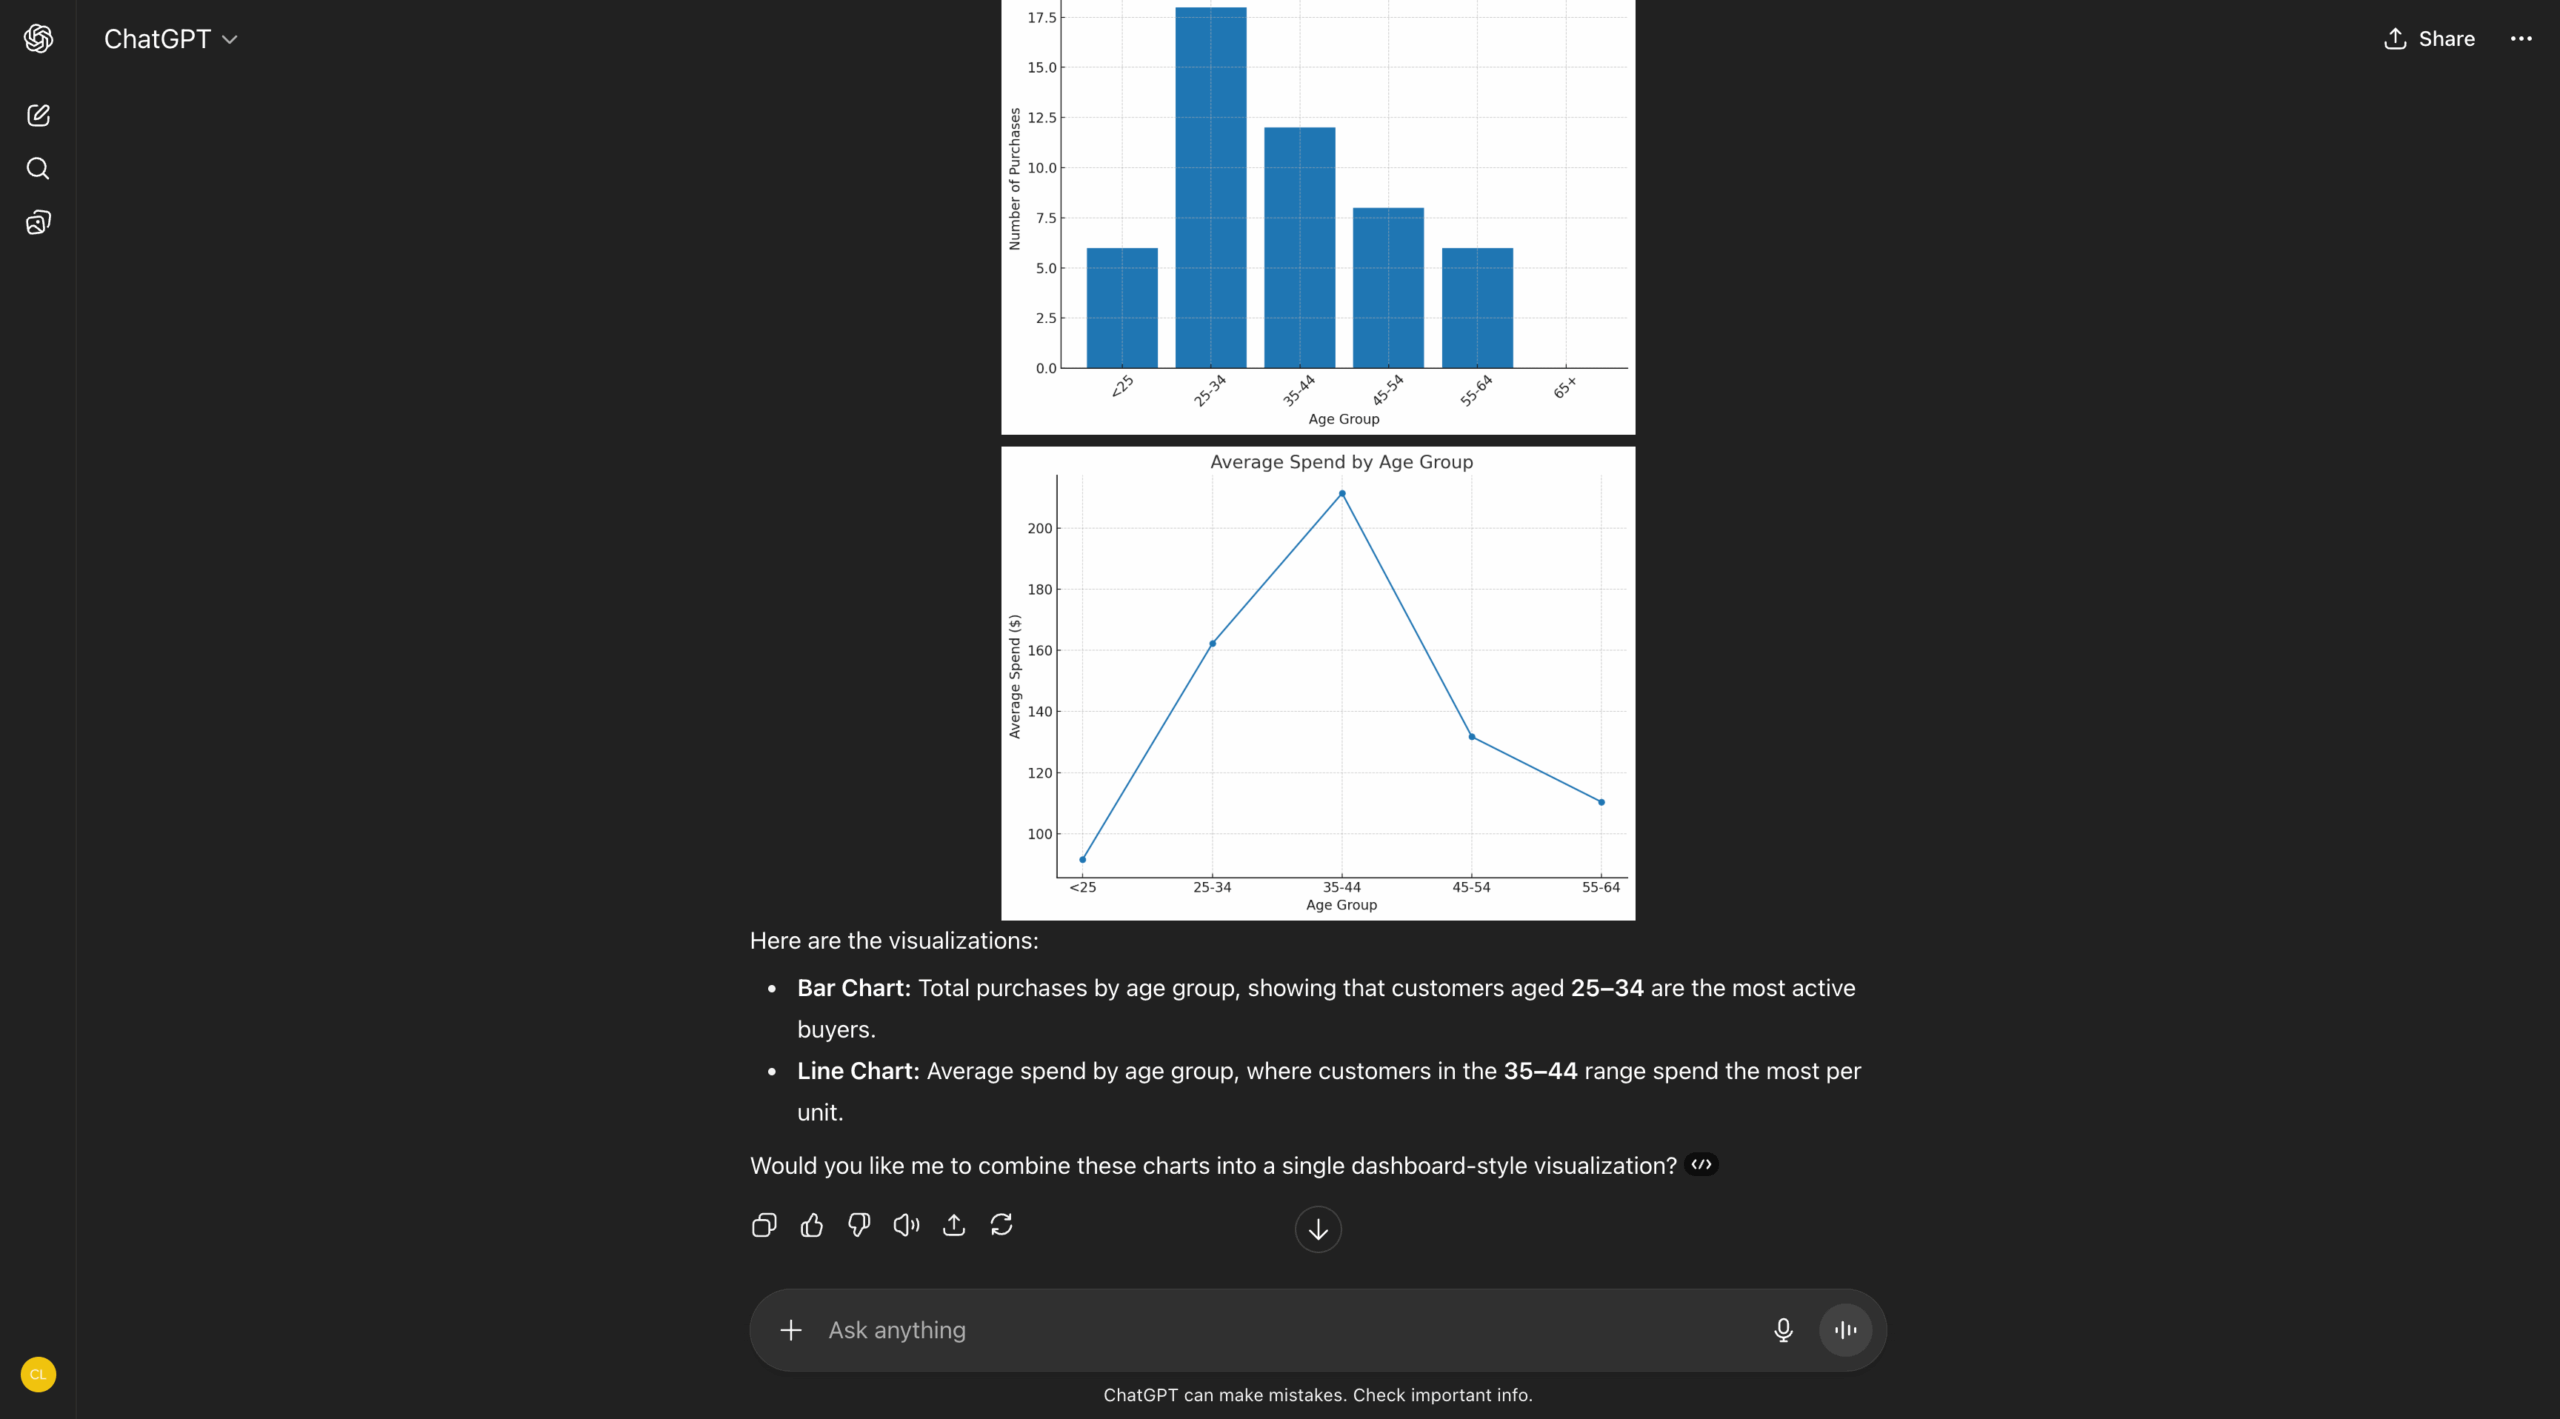
ChatGPT’s Advanced Data Analysis feature surprised me with its statistical capabilities. It was easy to upload a CSV file and ask conversational questions, and in response, I got regression analysis, clustering, custom visualizations, and detailed explanations of statistical concepts, all without the need for a translator to make sense of technical jargon.
What impressed me most was the educational value: ChatGPT explains not just what the results mean, but why certain statistical methods were chosen and how to interpret the findings. If anything went over my head, I could ask it to clarify to make sure I understood its insights. This combination is powerful for teams looking to improve statistical literacy while also getting immediate analysis results.
Pros:
- Offers an intuitive conversational interface for statistical analysis
- Generates and explains statistical code for learning
- Creates custom visualizations based on your specific questions
- Educational explanations help build statistical understanding
- Can write SQL, Python, and R code for statistical tasks
Cons:
- File size limitations restrict analysis of large datasets
- Cannot save or continue analysis projects
- Privacy may be a concern for sensitive business data
Plans/Pricing:
- Free plan available
- Business: $30 per month ($25 when billed annually)
G2 rating: 4.7/5
Jotform as an alternative AI statistics tool
Best for: Marketing teams collecting and analyzing survey feedback
Developer: Jotform Inc.
You should know: Combines data collection with instant analytics dashboards
Jotform AI Agents can be a great help for smaller teams or projects that need an all-in-one tool to collect and analyze form data. I tested it out by uploading my example dataset while training the AI Agent, and I was able to ask it questions about the data and pull basic statistical information. Although the AI Agent isn’t capable of complex analysis, it can significantly cut down on time and pull basic info for nontechnical users.
This platform shines for teams that need to measure customer satisfaction, product feedback, market research, or internal feedback. All you need to do is create your survey, then ask an AI Agent all about it — get easy access to the information you need without becoming an Excel pro.
You can even use Jotform’s reporting features to build charts and reports, bringing your insights to key stakeholders without leaving the platform. If you need a simple and easy-to-use closed data system, Jotform could be just the thing for your business.
Pros:
- No technical coding or statistical analysis experience needed to pull information from datasets
- Real-time updates as survey responses arrive for improved accuracy over time
- Seamless integration with marketing tools and CRMs to empower data-informed decisions
- AI Agents that can gather form data using natural language prompts
Cons:
- Unable to handle large data stores for businesses with large repositories
- Primarily designed for form-based data collection
- No advanced statistical capabilities for complex needs
Plans/Pricing:
- Free plan available
- Bronze plan: $34 per month when billed annually (contact Jotform for monthly rates)
G2 rating: 4.7/5
Automate your analytics with Jotform
From extensive market research to polling employee satisfaction, data management and statistical analysis play a role in every business. The best AI for statistics is one that employees can use to bolster insights and make the most of their data.
Simplify the process with help from Jotform, which lets you collect data, analyze it with a virtual agent, and present your statistical analysis all in one place.
FAQs
Yes, there are many AI tools for statistics that are capable of performing statistical analysis, including Datapad, Julius AI, and others.
Yes, you can use multiple AI tools to check for accuracy, pull different insights, and create various data visualization options.
AI tools can help analysts improve data interpretation by spotting patterns they might miss, automating data management and cleaning, and providing a partner for collaboration.
This article is for data analysts, researchers, marketing professionals, educators, and business teams who want to make sense of their data more efficiently using AI.


")


Send Comment: